Salvadoran vs Immigrants from Western Europe Median Family Income
COMPARE
Salvadoran
Immigrants from Western Europe
Median Family Income
Median Family Income Comparison
Salvadorans
Immigrants from Western Europe
$94,109
MEDIAN FAMILY INCOME
1.2/ 100
METRIC RATING
239th/ 347
METRIC RANK
$112,688
MEDIAN FAMILY INCOME
99.4/ 100
METRIC RATING
75th/ 347
METRIC RANK
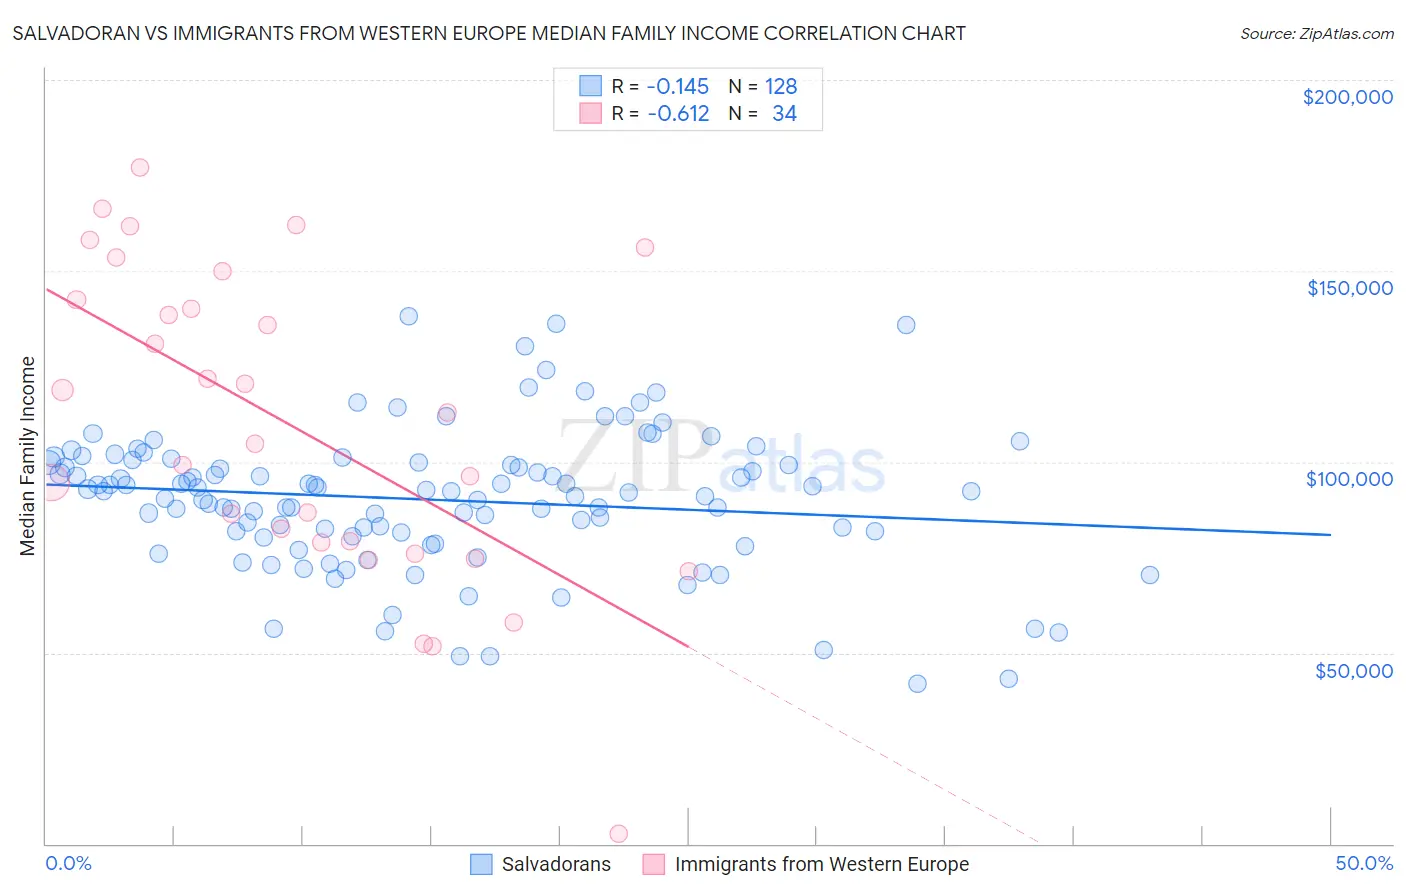
Salvadoran vs Immigrants from Western Europe Median Family Income Correlation Chart
The statistical analysis conducted on geographies consisting of 398,577,694 people shows a poor negative correlation between the proportion of Salvadorans and median family income in the United States with a correlation coefficient (R) of -0.145 and weighted average of $94,109. Similarly, the statistical analysis conducted on geographies consisting of 493,641,524 people shows a significant negative correlation between the proportion of Immigrants from Western Europe and median family income in the United States with a correlation coefficient (R) of -0.612 and weighted average of $112,688, a difference of 19.7%.
Median Family Income Correlation Summary
| Measurement | Salvadoran | Immigrants from Western Europe |
| Minimum | $41,966 | $2,499 |
| Maximum | $138,117 | $177,105 |
| Range | $96,151 | $174,606 |
| Mean | $90,099 | $109,288 |
| Median | $92,329 | $108,868 |
| Interquartile 25% (IQ1) | $81,022 | $78,809 |
| Interquartile 75% (IQ3) | $99,847 | $142,425 |
| Interquartile Range (IQR) | $18,825 | $63,615 |
| Standard Deviation (Sample) | $18,212 | $41,087 |
| Standard Deviation (Population) | $18,141 | $40,478 |
Similar Demographics by Median Family Income
Demographics Similar to Salvadorans by Median Family Income
In terms of median family income, the demographic groups most similar to Salvadorans are Somali ($94,085, a difference of 0.030%), Nepalese ($94,153, a difference of 0.050%), Immigrants from Trinidad and Tobago ($93,988, a difference of 0.13%), Barbadian ($93,919, a difference of 0.20%), and German Russian ($93,858, a difference of 0.27%).
| Demographics | Rating | Rank | Median Family Income |
| Immigrants | Venezuela | 1.9 /100 | #232 | Tragic $94,904 |
| Immigrants | Bangladesh | 1.6 /100 | #233 | Tragic $94,665 |
| Immigrants | Western Africa | 1.6 /100 | #234 | Tragic $94,638 |
| Immigrants | Burma/Myanmar | 1.5 /100 | #235 | Tragic $94,472 |
| Trinidadians and Tobagonians | 1.5 /100 | #236 | Tragic $94,466 |
| Alaskan Athabascans | 1.5 /100 | #237 | Tragic $94,429 |
| Nepalese | 1.3 /100 | #238 | Tragic $94,153 |
| Salvadorans | 1.2 /100 | #239 | Tragic $94,109 |
| Somalis | 1.2 /100 | #240 | Tragic $94,085 |
| Immigrants | Trinidad and Tobago | 1.2 /100 | #241 | Tragic $93,988 |
| Barbadians | 1.1 /100 | #242 | Tragic $93,919 |
| German Russians | 1.1 /100 | #243 | Tragic $93,858 |
| Sub-Saharan Africans | 1.0 /100 | #244 | Tragic $93,748 |
| Immigrants | Middle Africa | 1.0 /100 | #245 | Tragic $93,593 |
| Guyanese | 0.9 /100 | #246 | Tragic $93,373 |
Demographics Similar to Immigrants from Western Europe by Median Family Income
In terms of median family income, the demographic groups most similar to Immigrants from Western Europe are Argentinean ($112,665, a difference of 0.020%), Immigrants from Italy ($112,848, a difference of 0.14%), Immigrants from Eastern Europe ($112,527, a difference of 0.14%), Laotian ($112,859, a difference of 0.15%), and Afghan ($112,971, a difference of 0.25%).
| Demographics | Rating | Rank | Median Family Income |
| Immigrants | Serbia | 99.6 /100 | #68 | Exceptional $113,463 |
| Immigrants | Bulgaria | 99.6 /100 | #69 | Exceptional $113,461 |
| Immigrants | Romania | 99.6 /100 | #70 | Exceptional $113,434 |
| South Africans | 99.5 /100 | #71 | Exceptional $113,229 |
| Afghans | 99.5 /100 | #72 | Exceptional $112,971 |
| Laotians | 99.5 /100 | #73 | Exceptional $112,859 |
| Immigrants | Italy | 99.4 /100 | #74 | Exceptional $112,848 |
| Immigrants | Western Europe | 99.4 /100 | #75 | Exceptional $112,688 |
| Argentineans | 99.4 /100 | #76 | Exceptional $112,665 |
| Immigrants | Eastern Europe | 99.4 /100 | #77 | Exceptional $112,527 |
| Immigrants | Canada | 99.3 /100 | #78 | Exceptional $112,374 |
| Italians | 99.3 /100 | #79 | Exceptional $112,372 |
| Immigrants | Croatia | 99.3 /100 | #80 | Exceptional $112,323 |
| Immigrants | North America | 99.2 /100 | #81 | Exceptional $112,151 |
| Immigrants | England | 99.2 /100 | #82 | Exceptional $112,038 |