Armenian vs Immigrants from Western Europe Unemployment Among Ages 16 to 19 years
COMPARE
Armenian
Immigrants from Western Europe
Unemployment Among Ages 16 to 19 years
Unemployment Among Ages 16 to 19 years Comparison
Armenians
Immigrants from Western Europe
20.5%
UNEMPLOYMENT AMONG AGES 16 TO 19 YEARS
0.0/ 100
METRIC RATING
296th/ 347
METRIC RANK
17.6%
UNEMPLOYMENT AMONG AGES 16 TO 19 YEARS
52.2/ 100
METRIC RATING
172nd/ 347
METRIC RANK
Armenian vs Immigrants from Western Europe Unemployment Among Ages 16 to 19 years Correlation Chart
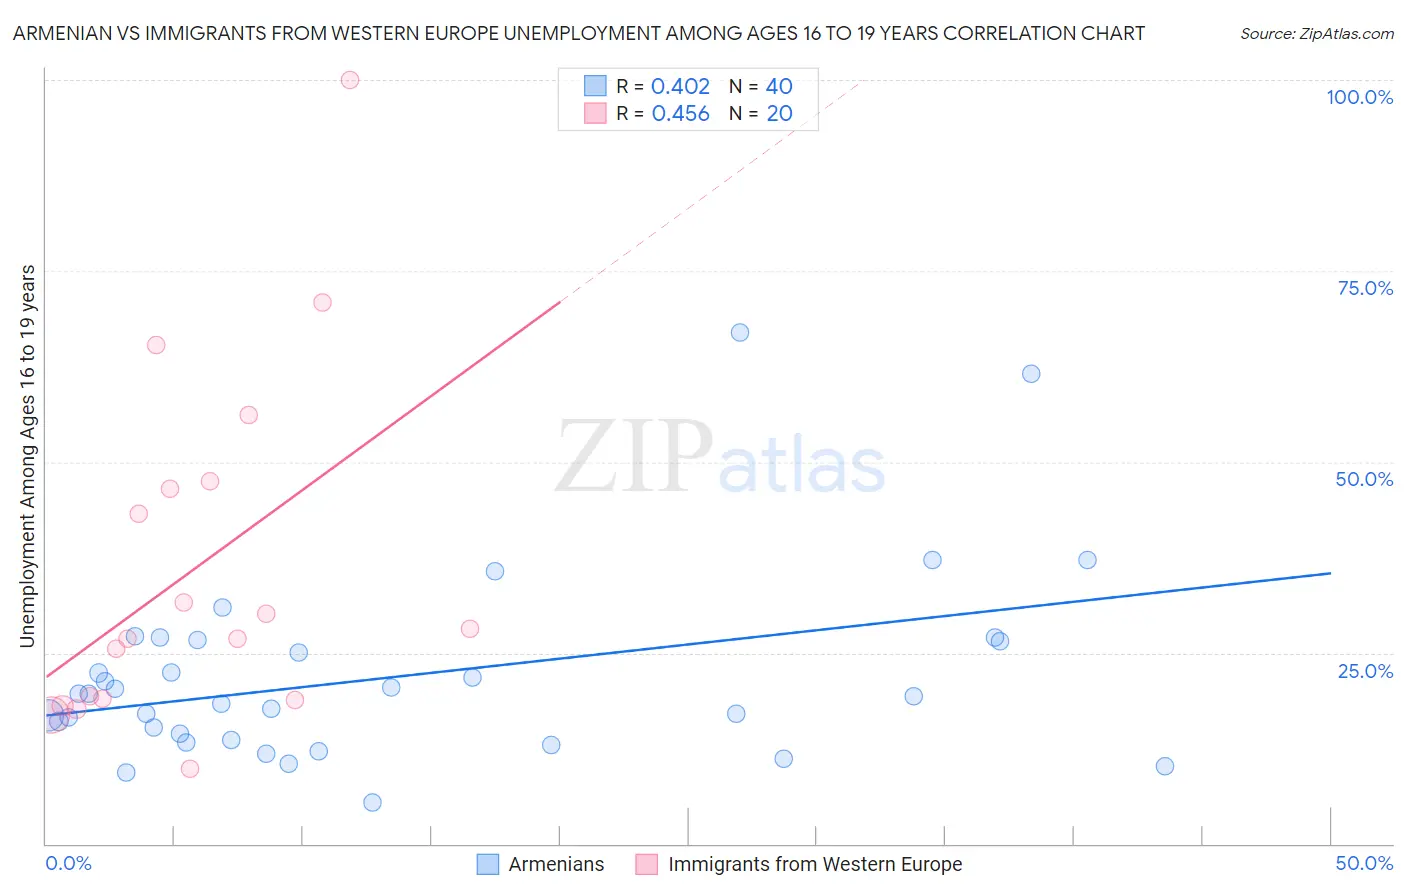
The statistical analysis conducted on geographies consisting of 296,100,961 people shows a moderate positive correlation between the proportion of Armenians and unemployment rate among population between the ages 16 and 19 in the United States with a correlation coefficient (R) of 0.402 and weighted average of 20.5%. Similarly, the statistical analysis conducted on geographies consisting of 457,110,117 people shows a moderate positive correlation between the proportion of Immigrants from Western Europe and unemployment rate among population between the ages 16 and 19 in the United States with a correlation coefficient (R) of 0.456 and weighted average of 17.6%, a difference of 16.8%.
Unemployment Among Ages 16 to 19 years Correlation Summary
| Measurement | Armenian | Immigrants from Western Europe |
| Minimum | 5.4% | 9.8% |
| Maximum | 67.0% | 100.0% |
| Range | 61.6% | 90.2% |
| Mean | 21.9% | 35.9% |
| Median | 19.4% | 27.5% |
| Interquartile 25% (IQ1) | 14.0% | 18.9% |
| Interquartile 75% (IQ3) | 26.6% | 46.9% |
| Interquartile Range (IQR) | 12.6% | 28.0% |
| Standard Deviation (Sample) | 12.4% | 22.8% |
| Standard Deviation (Population) | 12.2% | 22.2% |
Similar Demographics by Unemployment Among Ages 16 to 19 years
Demographics Similar to Armenians by Unemployment Among Ages 16 to 19 years
In terms of unemployment among ages 16 to 19 years, the demographic groups most similar to Armenians are Alsatian (20.5%, a difference of 0.030%), Haitian (20.5%, a difference of 0.080%), Immigrants from Uzbekistan (20.5%, a difference of 0.13%), Ecuadorian (20.5%, a difference of 0.22%), and Central American Indian (20.4%, a difference of 0.29%).
| Demographics | Rating | Rank | Unemployment Among Ages 16 to 19 years |
| Pueblo | 0.0 /100 | #289 | Tragic 19.8% |
| Immigrants | Sierra Leone | 0.0 /100 | #290 | Tragic 20.0% |
| Immigrants | Yemen | 0.0 /100 | #291 | Tragic 20.0% |
| Comanche | 0.0 /100 | #292 | Tragic 20.2% |
| Immigrants | Bahamas | 0.0 /100 | #293 | Tragic 20.4% |
| Immigrants | Haiti | 0.0 /100 | #294 | Tragic 20.4% |
| Central American Indians | 0.0 /100 | #295 | Tragic 20.4% |
| Armenians | 0.0 /100 | #296 | Tragic 20.5% |
| Alsatians | 0.0 /100 | #297 | Tragic 20.5% |
| Haitians | 0.0 /100 | #298 | Tragic 20.5% |
| Immigrants | Uzbekistan | 0.0 /100 | #299 | Tragic 20.5% |
| Ecuadorians | 0.0 /100 | #300 | Tragic 20.5% |
| Immigrants | Ecuador | 0.0 /100 | #301 | Tragic 20.9% |
| Immigrants | Caribbean | 0.0 /100 | #302 | Tragic 20.9% |
| Senegalese | 0.0 /100 | #303 | Tragic 21.0% |
Demographics Similar to Immigrants from Western Europe by Unemployment Among Ages 16 to 19 years
In terms of unemployment among ages 16 to 19 years, the demographic groups most similar to Immigrants from Western Europe are Immigrants from Romania (17.5%, a difference of 0.050%), Immigrants from Switzerland (17.5%, a difference of 0.050%), Chilean (17.6%, a difference of 0.070%), Immigrants from Cambodia (17.5%, a difference of 0.11%), and Osage (17.6%, a difference of 0.11%).
| Demographics | Rating | Rank | Unemployment Among Ages 16 to 19 years |
| Cape Verdeans | 55.8 /100 | #165 | Average 17.5% |
| Immigrants | Italy | 55.2 /100 | #166 | Average 17.5% |
| Immigrants | France | 54.9 /100 | #167 | Average 17.5% |
| Immigrants | Hungary | 54.7 /100 | #168 | Average 17.5% |
| Immigrants | Cambodia | 54.5 /100 | #169 | Average 17.5% |
| Immigrants | Romania | 53.3 /100 | #170 | Average 17.5% |
| Immigrants | Switzerland | 53.2 /100 | #171 | Average 17.5% |
| Immigrants | Western Europe | 52.2 /100 | #172 | Average 17.6% |
| Chileans | 50.8 /100 | #173 | Average 17.6% |
| Osage | 50.0 /100 | #174 | Average 17.6% |
| Immigrants | Sweden | 49.1 /100 | #175 | Average 17.6% |
| Nicaraguans | 48.9 /100 | #176 | Average 17.6% |
| Bermudans | 48.7 /100 | #177 | Average 17.6% |
| Celtics | 48.7 /100 | #178 | Average 17.6% |
| Americans | 47.4 /100 | #179 | Average 17.6% |