Armenian vs Spanish American Median Family Income
COMPARE
Armenian
Spanish American
Median Family Income
Median Family Income Comparison
Armenians
Spanish Americans
$109,692
MEDIAN FAMILY INCOME
97.3/ 100
METRIC RATING
99th/ 347
METRIC RANK
$90,322
MEDIAN FAMILY INCOME
0.2/ 100
METRIC RATING
274th/ 347
METRIC RANK
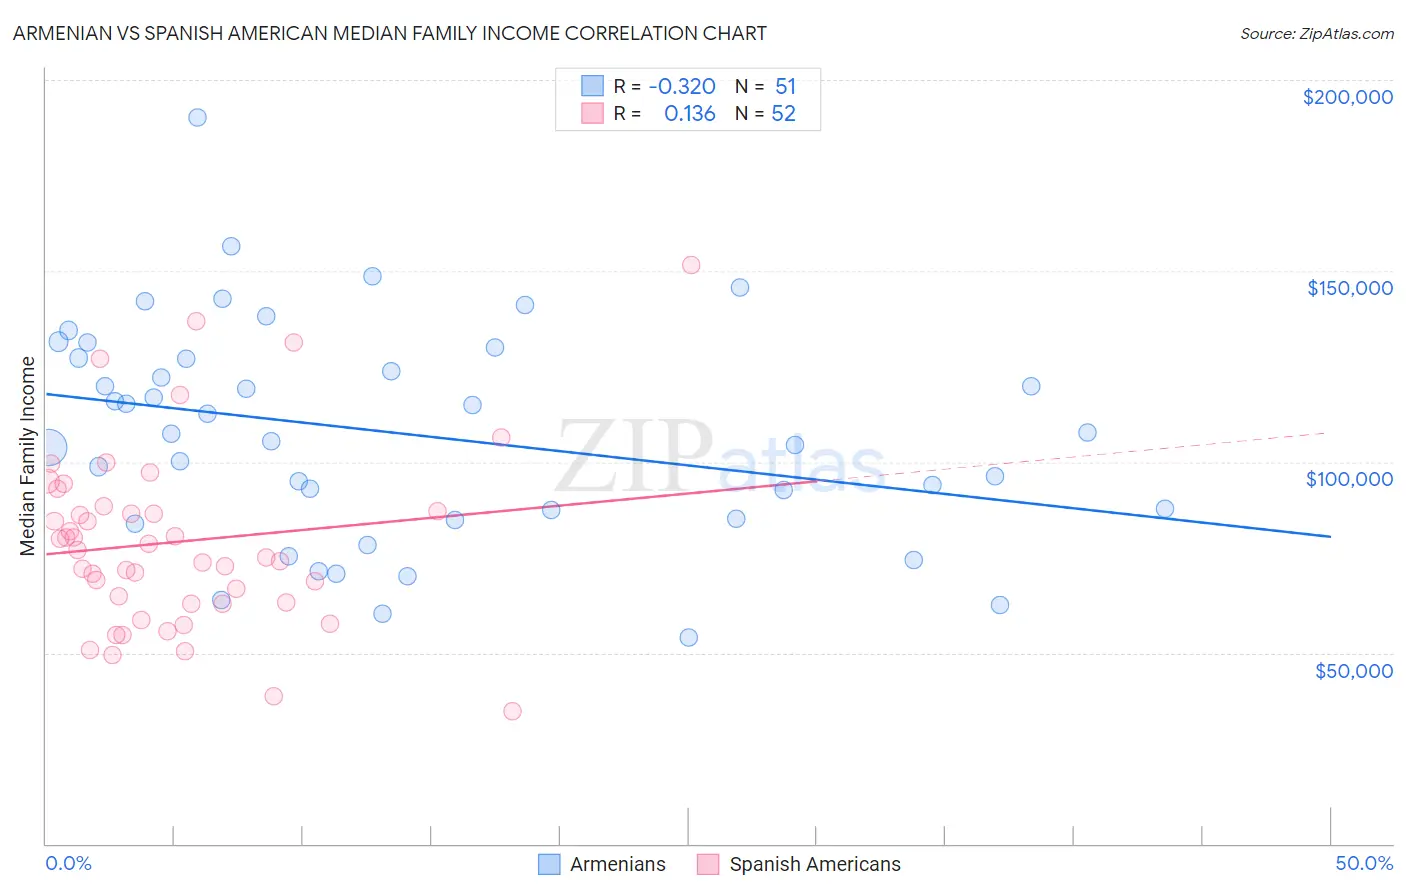
Armenian vs Spanish American Median Family Income Correlation Chart
The statistical analysis conducted on geographies consisting of 310,689,637 people shows a mild negative correlation between the proportion of Armenians and median family income in the United States with a correlation coefficient (R) of -0.320 and weighted average of $109,692. Similarly, the statistical analysis conducted on geographies consisting of 103,155,631 people shows a poor positive correlation between the proportion of Spanish Americans and median family income in the United States with a correlation coefficient (R) of 0.136 and weighted average of $90,322, a difference of 21.4%.
Median Family Income Correlation Summary
| Measurement | Armenian | Spanish American |
| Minimum | $54,063 | $34,804 |
| Maximum | $190,202 | $151,435 |
| Range | $136,139 | $116,631 |
| Mean | $107,343 | $79,090 |
| Median | $107,236 | $75,945 |
| Interquartile 25% (IQ1) | $85,128 | $62,996 |
| Interquartile 75% (IQ3) | $127,200 | $87,771 |
| Interquartile Range (IQR) | $42,071 | $24,775 |
| Standard Deviation (Sample) | $28,557 | $23,819 |
| Standard Deviation (Population) | $28,276 | $23,588 |
Similar Demographics by Median Family Income
Demographics Similar to Armenians by Median Family Income
In terms of median family income, the demographic groups most similar to Armenians are Macedonian ($109,668, a difference of 0.020%), Immigrants from Kuwait ($109,731, a difference of 0.040%), Immigrants from Ukraine ($109,645, a difference of 0.040%), Assyrian/Chaldean/Syriac ($109,622, a difference of 0.060%), and Jordanian ($109,865, a difference of 0.16%).
| Demographics | Rating | Rank | Median Family Income |
| Immigrants | Lebanon | 97.9 /100 | #92 | Exceptional $110,159 |
| Immigrants | Kazakhstan | 97.8 /100 | #93 | Exceptional $110,137 |
| Koreans | 97.8 /100 | #94 | Exceptional $110,103 |
| Zimbabweans | 97.7 /100 | #95 | Exceptional $110,011 |
| Immigrants | Moldova | 97.7 /100 | #96 | Exceptional $109,975 |
| Jordanians | 97.5 /100 | #97 | Exceptional $109,865 |
| Immigrants | Kuwait | 97.4 /100 | #98 | Exceptional $109,731 |
| Armenians | 97.3 /100 | #99 | Exceptional $109,692 |
| Macedonians | 97.3 /100 | #100 | Exceptional $109,668 |
| Immigrants | Ukraine | 97.2 /100 | #101 | Exceptional $109,645 |
| Assyrians/Chaldeans/Syriacs | 97.2 /100 | #102 | Exceptional $109,622 |
| Immigrants | Brazil | 96.9 /100 | #103 | Exceptional $109,418 |
| Palestinians | 96.9 /100 | #104 | Exceptional $109,413 |
| Syrians | 96.7 /100 | #105 | Exceptional $109,299 |
| Albanians | 96.4 /100 | #106 | Exceptional $109,136 |
Demographics Similar to Spanish Americans by Median Family Income
In terms of median family income, the demographic groups most similar to Spanish Americans are Immigrants from Micronesia ($90,345, a difference of 0.020%), Immigrants from Liberia ($90,450, a difference of 0.14%), Iroquois ($90,543, a difference of 0.24%), Immigrants from St. Vincent and the Grenadines ($90,094, a difference of 0.25%), and Jamaican ($90,581, a difference of 0.29%).
| Demographics | Rating | Rank | Median Family Income |
| Mexican American Indians | 0.2 /100 | #267 | Tragic $90,918 |
| Cree | 0.2 /100 | #268 | Tragic $90,882 |
| Belizeans | 0.2 /100 | #269 | Tragic $90,880 |
| Jamaicans | 0.2 /100 | #270 | Tragic $90,581 |
| Iroquois | 0.2 /100 | #271 | Tragic $90,543 |
| Immigrants | Liberia | 0.2 /100 | #272 | Tragic $90,450 |
| Immigrants | Micronesia | 0.2 /100 | #273 | Tragic $90,345 |
| Spanish Americans | 0.2 /100 | #274 | Tragic $90,322 |
| Immigrants | St. Vincent and the Grenadines | 0.2 /100 | #275 | Tragic $90,094 |
| Immigrants | Zaire | 0.1 /100 | #276 | Tragic $89,285 |
| Immigrants | Jamaica | 0.1 /100 | #277 | Tragic $89,268 |
| Immigrants | Grenada | 0.1 /100 | #278 | Tragic $89,249 |
| Immigrants | Belize | 0.1 /100 | #279 | Tragic $89,197 |
| British West Indians | 0.1 /100 | #280 | Tragic $88,987 |
| Blackfeet | 0.1 /100 | #281 | Tragic $88,717 |