Immigrants from Kazakhstan vs Immigrants from Western Europe Median Family Income
COMPARE
Immigrants from Kazakhstan
Immigrants from Western Europe
Median Family Income
Median Family Income Comparison
Immigrants from Kazakhstan
Immigrants from Western Europe
$110,137
MEDIAN FAMILY INCOME
97.8/ 100
METRIC RATING
93rd/ 347
METRIC RANK
$112,688
MEDIAN FAMILY INCOME
99.4/ 100
METRIC RATING
75th/ 347
METRIC RANK
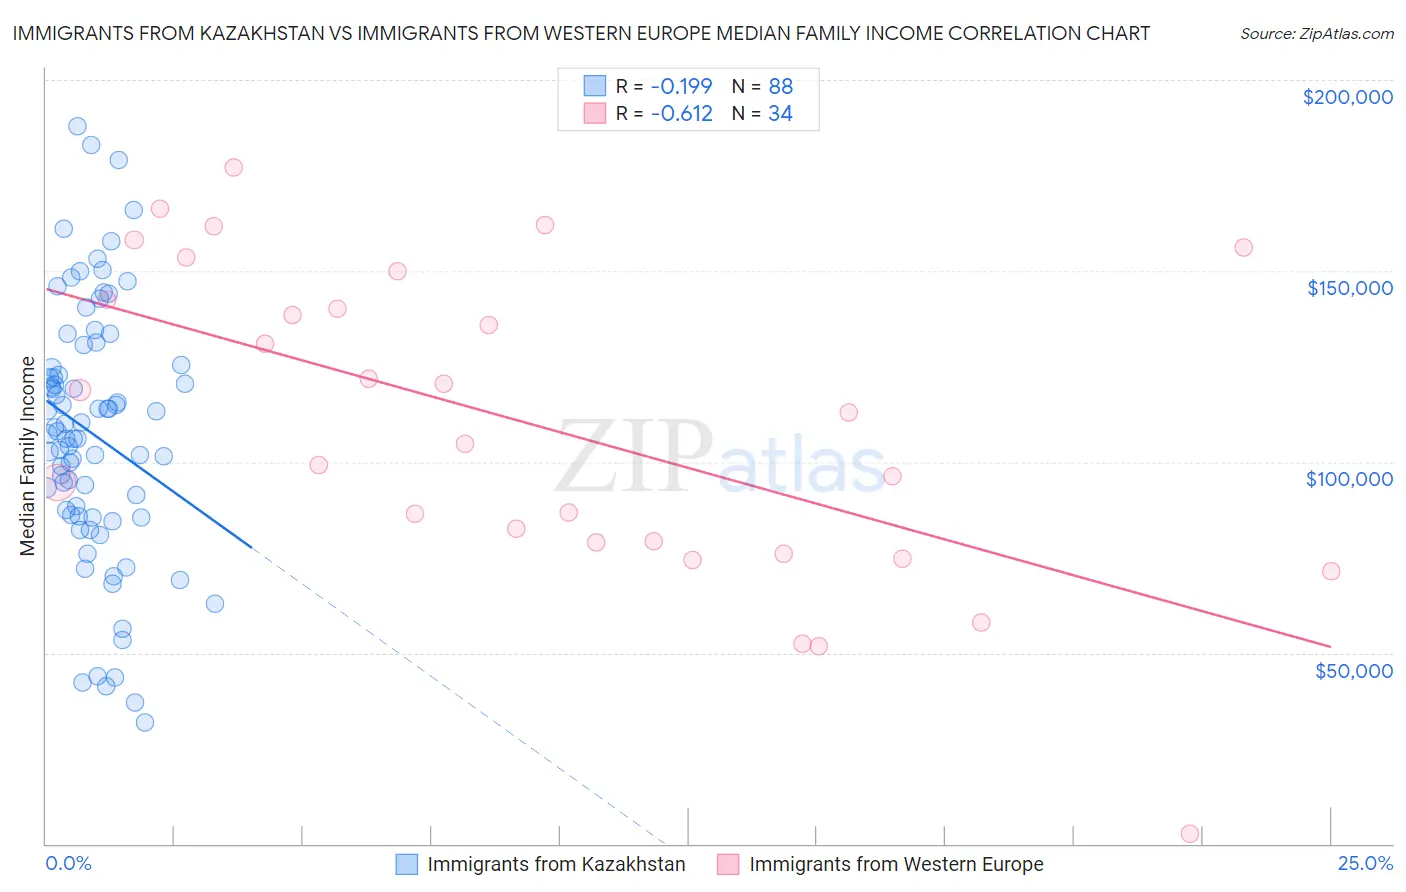
Immigrants from Kazakhstan vs Immigrants from Western Europe Median Family Income Correlation Chart
The statistical analysis conducted on geographies consisting of 124,424,095 people shows a poor negative correlation between the proportion of Immigrants from Kazakhstan and median family income in the United States with a correlation coefficient (R) of -0.199 and weighted average of $110,137. Similarly, the statistical analysis conducted on geographies consisting of 493,641,524 people shows a significant negative correlation between the proportion of Immigrants from Western Europe and median family income in the United States with a correlation coefficient (R) of -0.612 and weighted average of $112,688, a difference of 2.3%.
Median Family Income Correlation Summary
| Measurement | Immigrants from Kazakhstan | Immigrants from Western Europe |
| Minimum | $31,653 | $2,499 |
| Maximum | $187,745 | $177,105 |
| Range | $156,092 | $174,606 |
| Mean | $107,291 | $109,288 |
| Median | $107,620 | $108,868 |
| Interquartile 25% (IQ1) | $85,937 | $78,809 |
| Interquartile 75% (IQ3) | $125,121 | $142,425 |
| Interquartile Range (IQR) | $39,184 | $63,615 |
| Standard Deviation (Sample) | $33,362 | $41,087 |
| Standard Deviation (Population) | $33,172 | $40,478 |
Demographics Similar to Immigrants from Kazakhstan and Immigrants from Western Europe by Median Family Income
In terms of median family income, the demographic groups most similar to Immigrants from Kazakhstan are Immigrants from Lebanon ($110,159, a difference of 0.020%), Korean ($110,103, a difference of 0.030%), Immigrants from Southern Europe ($110,614, a difference of 0.43%), Northern European ($110,635, a difference of 0.45%), and Immigrants from Argentina ($110,873, a difference of 0.67%). Similarly, the demographic groups most similar to Immigrants from Western Europe are Argentinean ($112,665, a difference of 0.020%), Immigrants from Italy ($112,848, a difference of 0.14%), Immigrants from Eastern Europe ($112,527, a difference of 0.14%), Immigrants from Canada ($112,374, a difference of 0.28%), and Italian ($112,372, a difference of 0.28%).
| Demographics | Rating | Rank | Median Family Income |
| Immigrants | Italy | 99.4 /100 | #74 | Exceptional $112,848 |
| Immigrants | Western Europe | 99.4 /100 | #75 | Exceptional $112,688 |
| Argentineans | 99.4 /100 | #76 | Exceptional $112,665 |
| Immigrants | Eastern Europe | 99.4 /100 | #77 | Exceptional $112,527 |
| Immigrants | Canada | 99.3 /100 | #78 | Exceptional $112,374 |
| Italians | 99.3 /100 | #79 | Exceptional $112,372 |
| Immigrants | Croatia | 99.3 /100 | #80 | Exceptional $112,323 |
| Immigrants | North America | 99.2 /100 | #81 | Exceptional $112,151 |
| Immigrants | England | 99.2 /100 | #82 | Exceptional $112,038 |
| Immigrants | Egypt | 99.0 /100 | #83 | Exceptional $111,689 |
| Immigrants | Hungary | 98.8 /100 | #84 | Exceptional $111,378 |
| Croatians | 98.8 /100 | #85 | Exceptional $111,370 |
| Ukrainians | 98.8 /100 | #86 | Exceptional $111,368 |
| Austrians | 98.8 /100 | #87 | Exceptional $111,306 |
| Romanians | 98.8 /100 | #88 | Exceptional $111,243 |
| Immigrants | Argentina | 98.5 /100 | #89 | Exceptional $110,873 |
| Northern Europeans | 98.3 /100 | #90 | Exceptional $110,635 |
| Immigrants | Southern Europe | 98.3 /100 | #91 | Exceptional $110,614 |
| Immigrants | Lebanon | 97.9 /100 | #92 | Exceptional $110,159 |
| Immigrants | Kazakhstan | 97.8 /100 | #93 | Exceptional $110,137 |
| Koreans | 97.8 /100 | #94 | Exceptional $110,103 |