Armenian vs Immigrants from Japan Median Family Income
COMPARE
Armenian
Immigrants from Japan
Median Family Income
Median Family Income Comparison
Armenians
Immigrants from Japan
$109,692
MEDIAN FAMILY INCOME
97.3/ 100
METRIC RATING
99th/ 347
METRIC RANK
$122,764
MEDIAN FAMILY INCOME
100.0/ 100
METRIC RATING
23rd/ 347
METRIC RANK
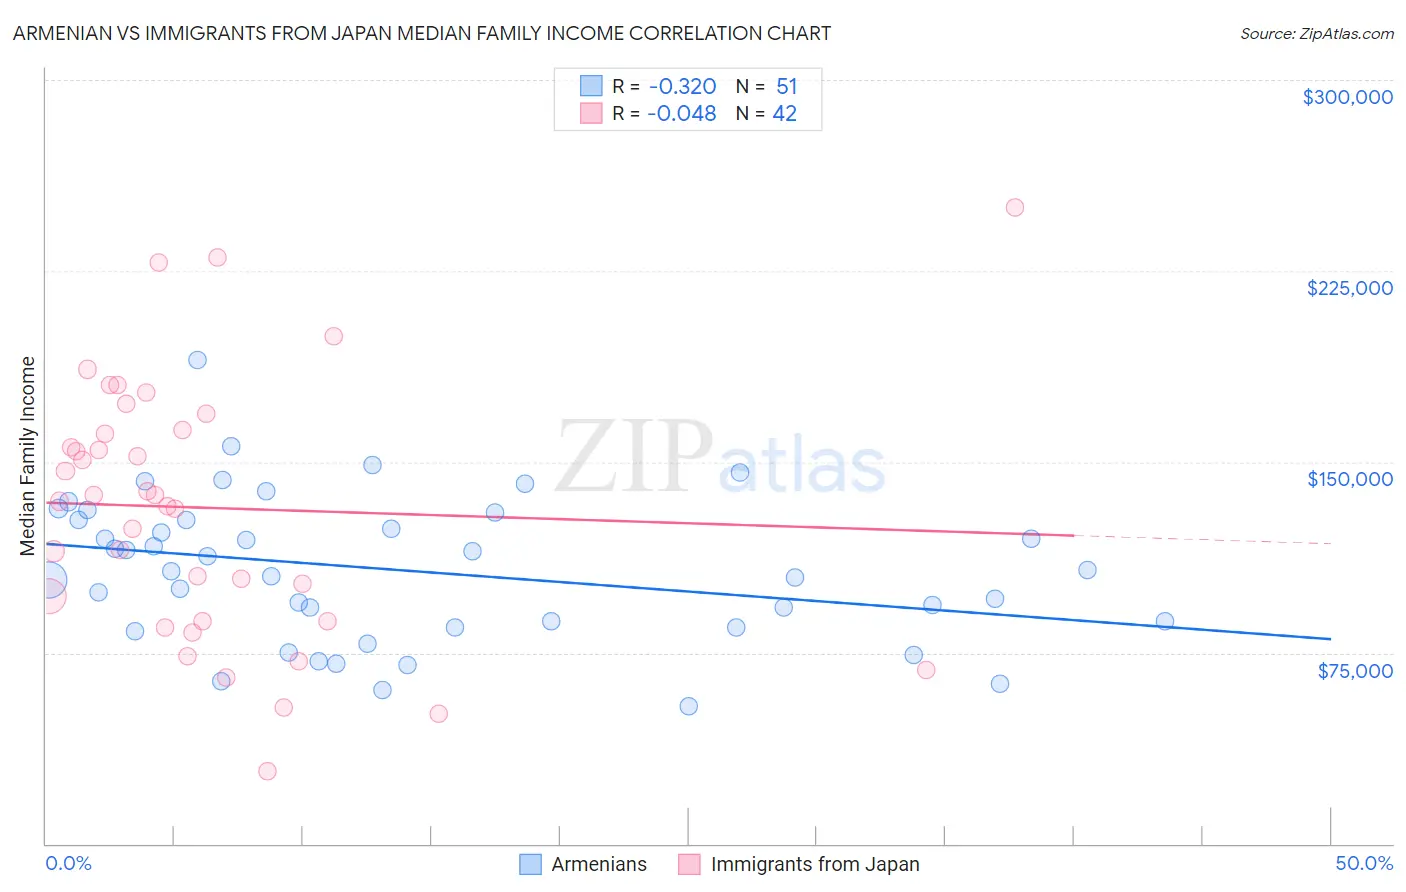
Armenian vs Immigrants from Japan Median Family Income Correlation Chart
The statistical analysis conducted on geographies consisting of 310,689,637 people shows a mild negative correlation between the proportion of Armenians and median family income in the United States with a correlation coefficient (R) of -0.320 and weighted average of $109,692. Similarly, the statistical analysis conducted on geographies consisting of 339,915,551 people shows no correlation between the proportion of Immigrants from Japan and median family income in the United States with a correlation coefficient (R) of -0.048 and weighted average of $122,764, a difference of 11.9%.
Median Family Income Correlation Summary
| Measurement | Armenian | Immigrants from Japan |
| Minimum | $54,063 | $28,538 |
| Maximum | $190,202 | $250,001 |
| Range | $136,139 | $221,463 |
| Mean | $107,343 | $131,921 |
| Median | $107,236 | $135,669 |
| Interquartile 25% (IQ1) | $85,128 | $87,578 |
| Interquartile 75% (IQ3) | $127,200 | $162,396 |
| Interquartile Range (IQR) | $42,071 | $74,818 |
| Standard Deviation (Sample) | $28,557 | $50,889 |
| Standard Deviation (Population) | $28,276 | $50,280 |
Similar Demographics by Median Family Income
Demographics Similar to Armenians by Median Family Income
In terms of median family income, the demographic groups most similar to Armenians are Macedonian ($109,668, a difference of 0.020%), Immigrants from Kuwait ($109,731, a difference of 0.040%), Immigrants from Ukraine ($109,645, a difference of 0.040%), Assyrian/Chaldean/Syriac ($109,622, a difference of 0.060%), and Jordanian ($109,865, a difference of 0.16%).
| Demographics | Rating | Rank | Median Family Income |
| Immigrants | Lebanon | 97.9 /100 | #92 | Exceptional $110,159 |
| Immigrants | Kazakhstan | 97.8 /100 | #93 | Exceptional $110,137 |
| Koreans | 97.8 /100 | #94 | Exceptional $110,103 |
| Zimbabweans | 97.7 /100 | #95 | Exceptional $110,011 |
| Immigrants | Moldova | 97.7 /100 | #96 | Exceptional $109,975 |
| Jordanians | 97.5 /100 | #97 | Exceptional $109,865 |
| Immigrants | Kuwait | 97.4 /100 | #98 | Exceptional $109,731 |
| Armenians | 97.3 /100 | #99 | Exceptional $109,692 |
| Macedonians | 97.3 /100 | #100 | Exceptional $109,668 |
| Immigrants | Ukraine | 97.2 /100 | #101 | Exceptional $109,645 |
| Assyrians/Chaldeans/Syriacs | 97.2 /100 | #102 | Exceptional $109,622 |
| Immigrants | Brazil | 96.9 /100 | #103 | Exceptional $109,418 |
| Palestinians | 96.9 /100 | #104 | Exceptional $109,413 |
| Syrians | 96.7 /100 | #105 | Exceptional $109,299 |
| Albanians | 96.4 /100 | #106 | Exceptional $109,136 |
Demographics Similar to Immigrants from Japan by Median Family Income
In terms of median family income, the demographic groups most similar to Immigrants from Japan are Immigrants from Sweden ($122,765, a difference of 0.0%), Immigrants from Korea ($122,800, a difference of 0.030%), Burmese ($123,369, a difference of 0.49%), Immigrants from Northern Europe ($121,840, a difference of 0.76%), and Immigrants from Belgium ($123,831, a difference of 0.87%).
| Demographics | Rating | Rank | Median Family Income |
| Immigrants | China | 100.0 /100 | #16 | Exceptional $125,540 |
| Indians (Asian) | 100.0 /100 | #17 | Exceptional $125,312 |
| Immigrants | Eastern Asia | 100.0 /100 | #18 | Exceptional $125,150 |
| Immigrants | Belgium | 100.0 /100 | #19 | Exceptional $123,831 |
| Burmese | 100.0 /100 | #20 | Exceptional $123,369 |
| Immigrants | Korea | 100.0 /100 | #21 | Exceptional $122,800 |
| Immigrants | Sweden | 100.0 /100 | #22 | Exceptional $122,765 |
| Immigrants | Japan | 100.0 /100 | #23 | Exceptional $122,764 |
| Immigrants | Northern Europe | 100.0 /100 | #24 | Exceptional $121,840 |
| Turks | 100.0 /100 | #25 | Exceptional $121,202 |
| Immigrants | Switzerland | 100.0 /100 | #26 | Exceptional $120,726 |
| Russians | 100.0 /100 | #27 | Exceptional $120,487 |
| Immigrants | Denmark | 100.0 /100 | #28 | Exceptional $120,445 |
| Latvians | 100.0 /100 | #29 | Exceptional $120,301 |
| Immigrants | Sri Lanka | 100.0 /100 | #30 | Exceptional $120,263 |