Armenian vs Yaqui Per Capita Income
COMPARE
Armenian
Yaqui
Per Capita Income
Per Capita Income Comparison
Armenians
Yaqui
$48,287
PER CAPITA INCOME
99.4/ 100
METRIC RATING
81st/ 347
METRIC RANK
$36,112
PER CAPITA INCOME
0.0/ 100
METRIC RATING
315th/ 347
METRIC RANK
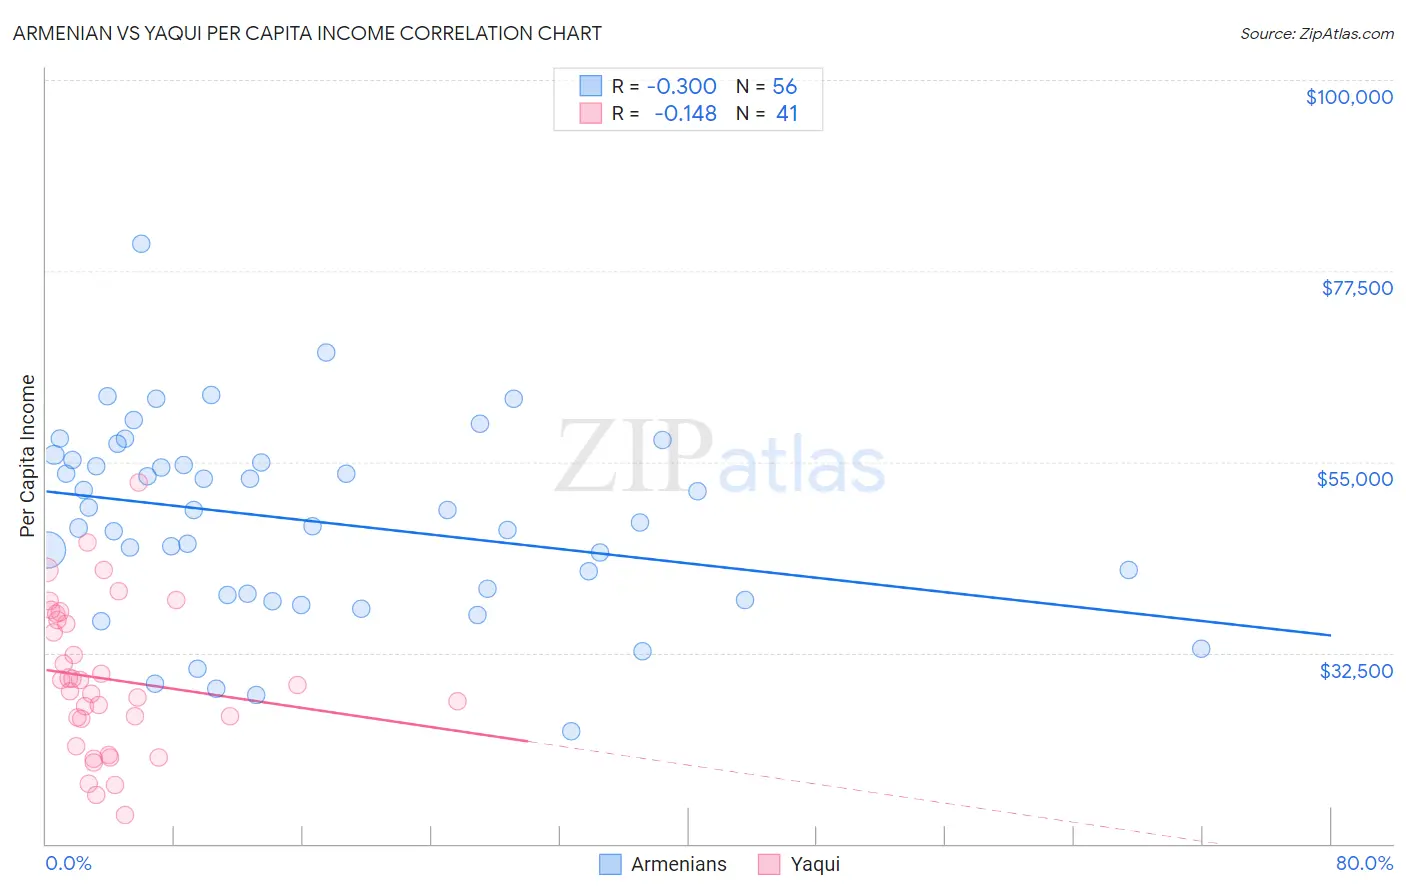
Armenian vs Yaqui Per Capita Income Correlation Chart
The statistical analysis conducted on geographies consisting of 310,965,464 people shows a mild negative correlation between the proportion of Armenians and per capita income in the United States with a correlation coefficient (R) of -0.300 and weighted average of $48,287. Similarly, the statistical analysis conducted on geographies consisting of 107,738,640 people shows a poor negative correlation between the proportion of Yaqui and per capita income in the United States with a correlation coefficient (R) of -0.148 and weighted average of $36,112, a difference of 33.7%.
Per Capita Income Correlation Summary
| Measurement | Armenian | Yaqui |
| Minimum | $23,281 | $13,349 |
| Maximum | $80,691 | $52,546 |
| Range | $57,410 | $39,197 |
| Mean | $48,045 | $29,404 |
| Median | $48,616 | $28,671 |
| Interquartile 25% (IQ1) | $39,345 | $23,138 |
| Interquartile 75% (IQ3) | $55,100 | $36,720 |
| Interquartile Range (IQR) | $15,755 | $13,582 |
| Standard Deviation (Sample) | $11,238 | $8,788 |
| Standard Deviation (Population) | $11,138 | $8,680 |
Similar Demographics by Per Capita Income
Demographics Similar to Armenians by Per Capita Income
In terms of per capita income, the demographic groups most similar to Armenians are Egyptian ($48,358, a difference of 0.15%), Immigrants from Indonesia ($48,195, a difference of 0.19%), Immigrants from Brazil ($48,164, a difference of 0.26%), Immigrants from Ukraine ($48,134, a difference of 0.32%), and Romanian ($48,445, a difference of 0.33%).
| Demographics | Rating | Rank | Per Capita Income |
| Mongolians | 99.8 /100 | #74 | Exceptional $49,173 |
| Immigrants | Bolivia | 99.7 /100 | #75 | Exceptional $48,970 |
| Immigrants | England | 99.7 /100 | #76 | Exceptional $48,844 |
| Immigrants | Kazakhstan | 99.7 /100 | #77 | Exceptional $48,747 |
| Immigrants | Italy | 99.6 /100 | #78 | Exceptional $48,654 |
| Romanians | 99.5 /100 | #79 | Exceptional $48,445 |
| Egyptians | 99.5 /100 | #80 | Exceptional $48,358 |
| Armenians | 99.4 /100 | #81 | Exceptional $48,287 |
| Immigrants | Indonesia | 99.4 /100 | #82 | Exceptional $48,195 |
| Immigrants | Brazil | 99.4 /100 | #83 | Exceptional $48,164 |
| Immigrants | Ukraine | 99.3 /100 | #84 | Exceptional $48,134 |
| Austrians | 99.3 /100 | #85 | Exceptional $48,116 |
| Immigrants | Southern Europe | 99.3 /100 | #86 | Exceptional $48,027 |
| Ukrainians | 99.3 /100 | #87 | Exceptional $48,014 |
| Croatians | 99.0 /100 | #88 | Exceptional $47,742 |
Demographics Similar to Yaqui by Per Capita Income
In terms of per capita income, the demographic groups most similar to Yaqui are Seminole ($36,180, a difference of 0.19%), Choctaw ($35,999, a difference of 0.31%), Dutch West Indian ($35,922, a difference of 0.53%), Bangladeshi ($35,897, a difference of 0.60%), and Bahamian ($36,427, a difference of 0.87%).
| Demographics | Rating | Rank | Per Capita Income |
| Fijians | 0.0 /100 | #308 | Tragic $36,690 |
| Immigrants | Honduras | 0.0 /100 | #309 | Tragic $36,665 |
| Ute | 0.0 /100 | #310 | Tragic $36,651 |
| Chippewa | 0.0 /100 | #311 | Tragic $36,631 |
| Chickasaw | 0.0 /100 | #312 | Tragic $36,475 |
| Bahamians | 0.0 /100 | #313 | Tragic $36,427 |
| Seminole | 0.0 /100 | #314 | Tragic $36,180 |
| Yaqui | 0.0 /100 | #315 | Tragic $36,112 |
| Choctaw | 0.0 /100 | #316 | Tragic $35,999 |
| Dutch West Indians | 0.0 /100 | #317 | Tragic $35,922 |
| Bangladeshis | 0.0 /100 | #318 | Tragic $35,897 |
| Immigrants | Congo | 0.0 /100 | #319 | Tragic $35,720 |
| Hispanics or Latinos | 0.0 /100 | #320 | Tragic $35,688 |
| Blacks/African Americans | 0.0 /100 | #321 | Tragic $35,564 |
| Creek | 0.0 /100 | #322 | Tragic $35,546 |