Armenian vs Mongolian Per Capita Income
COMPARE
Armenian
Mongolian
Per Capita Income
Per Capita Income Comparison
Armenians
Mongolians
$48,287
PER CAPITA INCOME
99.4/ 100
METRIC RATING
81st/ 347
METRIC RANK
$49,173
PER CAPITA INCOME
99.8/ 100
METRIC RATING
74th/ 347
METRIC RANK
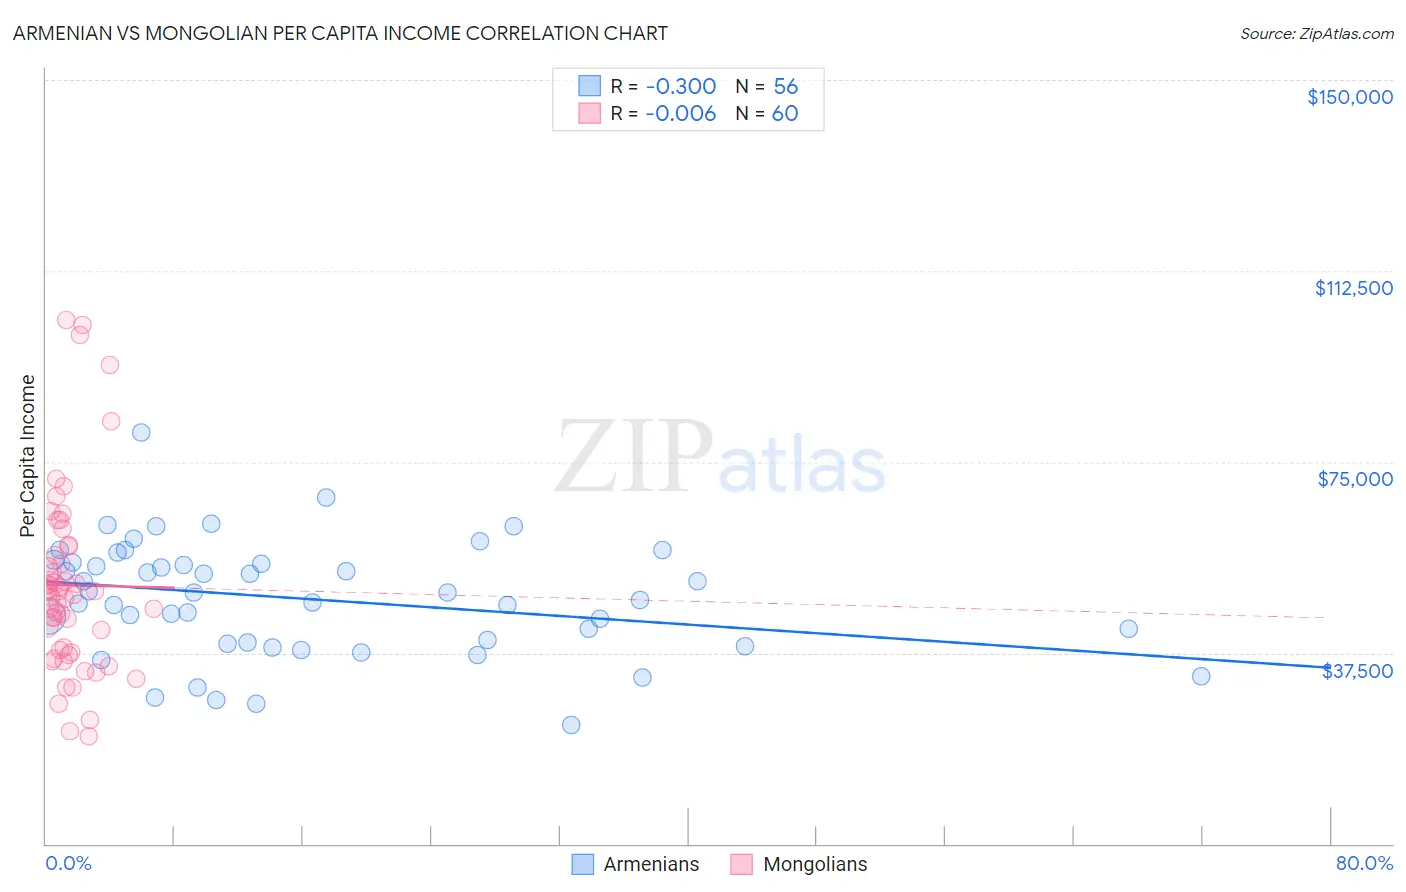
Armenian vs Mongolian Per Capita Income Correlation Chart
The statistical analysis conducted on geographies consisting of 310,965,464 people shows a mild negative correlation between the proportion of Armenians and per capita income in the United States with a correlation coefficient (R) of -0.300 and weighted average of $48,287. Similarly, the statistical analysis conducted on geographies consisting of 140,356,705 people shows no correlation between the proportion of Mongolians and per capita income in the United States with a correlation coefficient (R) of -0.006 and weighted average of $49,173, a difference of 1.8%.
Per Capita Income Correlation Summary
| Measurement | Armenian | Mongolian |
| Minimum | $23,281 | $21,025 |
| Maximum | $80,691 | $102,845 |
| Range | $57,410 | $81,820 |
| Mean | $48,045 | $50,803 |
| Median | $48,616 | $49,216 |
| Interquartile 25% (IQ1) | $39,345 | $37,778 |
| Interquartile 75% (IQ3) | $55,100 | $57,579 |
| Interquartile Range (IQR) | $15,755 | $19,802 |
| Standard Deviation (Sample) | $11,238 | $18,159 |
| Standard Deviation (Population) | $11,138 | $18,007 |
Demographics Similar to Armenians and Mongolians by Per Capita Income
In terms of per capita income, the demographic groups most similar to Armenians are Egyptian ($48,358, a difference of 0.15%), Immigrants from Indonesia ($48,195, a difference of 0.19%), Immigrants from Brazil ($48,164, a difference of 0.26%), Immigrants from Ukraine ($48,134, a difference of 0.32%), and Romanian ($48,445, a difference of 0.33%). Similarly, the demographic groups most similar to Mongolians are Immigrants from Hungary ($49,303, a difference of 0.26%), Immigrants from North America ($49,302, a difference of 0.26%), Greek ($49,309, a difference of 0.28%), Immigrants from Eastern Europe ($49,316, a difference of 0.29%), and Immigrants from Bolivia ($48,970, a difference of 0.41%).
| Demographics | Rating | Rank | Per Capita Income |
| Immigrants | Romania | 99.9 /100 | #67 | Exceptional $49,463 |
| Lithuanians | 99.8 /100 | #68 | Exceptional $49,448 |
| Immigrants | Canada | 99.8 /100 | #69 | Exceptional $49,412 |
| Immigrants | Eastern Europe | 99.8 /100 | #70 | Exceptional $49,316 |
| Greeks | 99.8 /100 | #71 | Exceptional $49,309 |
| Immigrants | Hungary | 99.8 /100 | #72 | Exceptional $49,303 |
| Immigrants | North America | 99.8 /100 | #73 | Exceptional $49,302 |
| Mongolians | 99.8 /100 | #74 | Exceptional $49,173 |
| Immigrants | Bolivia | 99.7 /100 | #75 | Exceptional $48,970 |
| Immigrants | England | 99.7 /100 | #76 | Exceptional $48,844 |
| Immigrants | Kazakhstan | 99.7 /100 | #77 | Exceptional $48,747 |
| Immigrants | Italy | 99.6 /100 | #78 | Exceptional $48,654 |
| Romanians | 99.5 /100 | #79 | Exceptional $48,445 |
| Egyptians | 99.5 /100 | #80 | Exceptional $48,358 |
| Armenians | 99.4 /100 | #81 | Exceptional $48,287 |
| Immigrants | Indonesia | 99.4 /100 | #82 | Exceptional $48,195 |
| Immigrants | Brazil | 99.4 /100 | #83 | Exceptional $48,164 |
| Immigrants | Ukraine | 99.3 /100 | #84 | Exceptional $48,134 |
| Austrians | 99.3 /100 | #85 | Exceptional $48,116 |
| Immigrants | Southern Europe | 99.3 /100 | #86 | Exceptional $48,027 |
| Ukrainians | 99.3 /100 | #87 | Exceptional $48,014 |