Argentinean vs Immigrants from Sierra Leone Wage/Income Gap
COMPARE
Argentinean
Immigrants from Sierra Leone
Wage/Income Gap
Wage/Income Gap Comparison
Argentineans
Immigrants from Sierra Leone
27.0%
WAGE/INCOME GAP
5.2/ 100
METRIC RATING
232nd/ 347
METRIC RANK
21.4%
WAGE/INCOME GAP
100.0/ 100
METRIC RATING
42nd/ 347
METRIC RANK
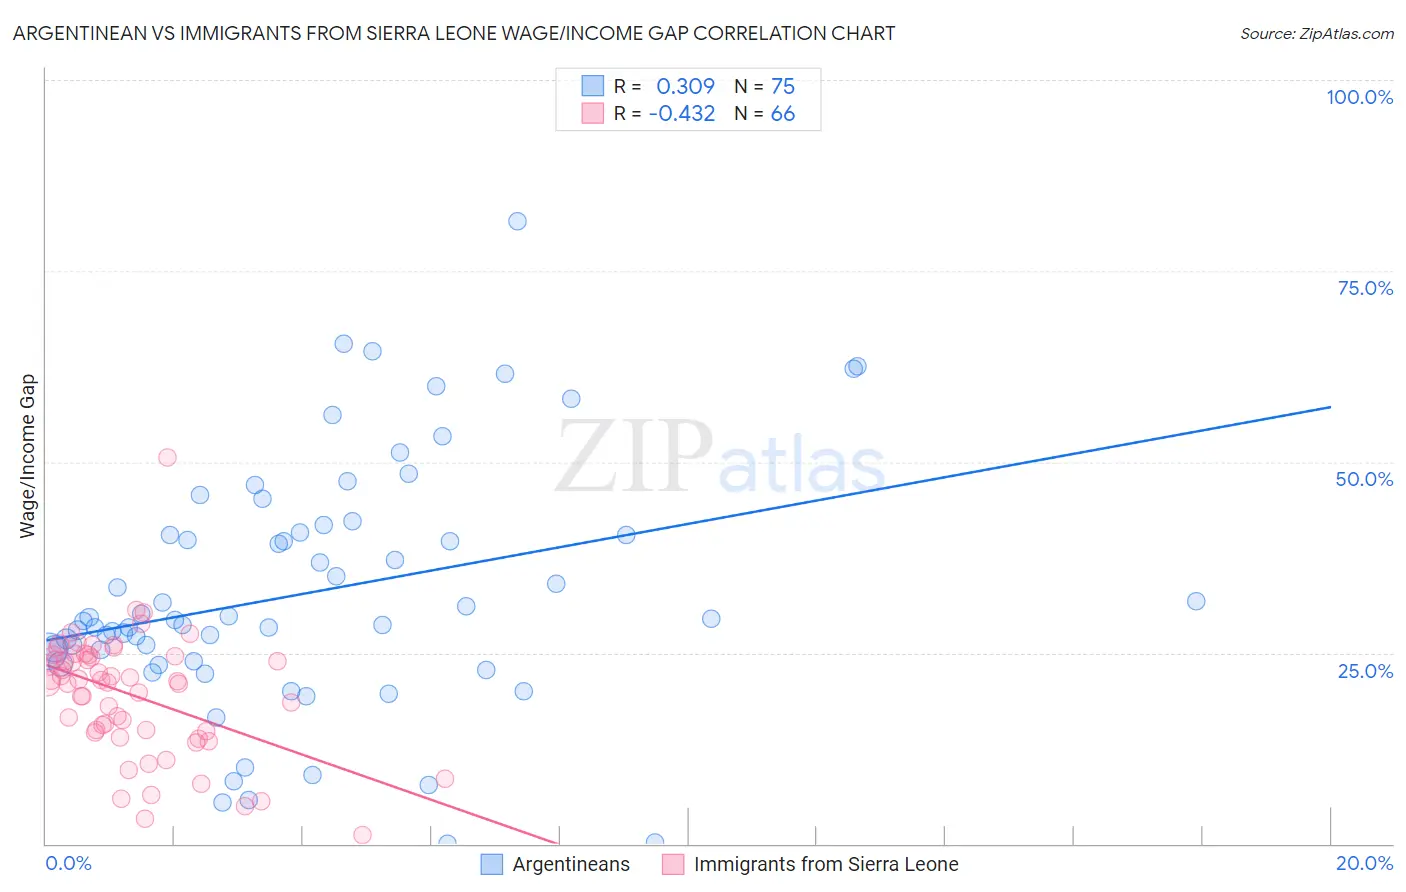
Argentinean vs Immigrants from Sierra Leone Wage/Income Gap Correlation Chart
The statistical analysis conducted on geographies consisting of 297,053,015 people shows a mild positive correlation between the proportion of Argentineans and wage/income gap percentage in the United States with a correlation coefficient (R) of 0.309 and weighted average of 27.0%. Similarly, the statistical analysis conducted on geographies consisting of 101,633,486 people shows a moderate negative correlation between the proportion of Immigrants from Sierra Leone and wage/income gap percentage in the United States with a correlation coefficient (R) of -0.432 and weighted average of 21.4%, a difference of 26.0%.
Wage/Income Gap Correlation Summary
| Measurement | Argentinean | Immigrants from Sierra Leone |
| Minimum | 0.074% | 1.1% |
| Maximum | 81.5% | 50.6% |
| Range | 81.4% | 49.5% |
| Mean | 32.9% | 19.5% |
| Median | 29.2% | 21.2% |
| Interquartile 25% (IQ1) | 24.0% | 14.7% |
| Interquartile 75% (IQ3) | 40.7% | 24.6% |
| Interquartile Range (IQR) | 16.8% | 9.9% |
| Standard Deviation (Sample) | 16.2% | 8.0% |
| Standard Deviation (Population) | 16.1% | 8.0% |
Similar Demographics by Wage/Income Gap
Demographics Similar to Argentineans by Wage/Income Gap
In terms of wage/income gap, the demographic groups most similar to Argentineans are Bhutanese (27.0%, a difference of 0.020%), Ottawa (27.0%, a difference of 0.050%), Immigrants from Brazil (27.0%, a difference of 0.060%), Immigrants from Asia (27.0%, a difference of 0.10%), and Immigrants from Pakistan (27.0%, a difference of 0.11%).
| Demographics | Rating | Rank | Wage/Income Gap |
| Immigrants | Ireland | 6.5 /100 | #225 | Tragic 26.9% |
| Asians | 5.9 /100 | #226 | Tragic 26.9% |
| Spaniards | 5.6 /100 | #227 | Tragic 27.0% |
| Immigrants | Turkey | 5.6 /100 | #228 | Tragic 27.0% |
| Immigrants | Asia | 5.5 /100 | #229 | Tragic 27.0% |
| Ottawa | 5.3 /100 | #230 | Tragic 27.0% |
| Bhutanese | 5.3 /100 | #231 | Tragic 27.0% |
| Argentineans | 5.2 /100 | #232 | Tragic 27.0% |
| Immigrants | Brazil | 5.0 /100 | #233 | Tragic 27.0% |
| Immigrants | Pakistan | 4.9 /100 | #234 | Tragic 27.0% |
| Immigrants | Hungary | 4.8 /100 | #235 | Tragic 27.0% |
| Immigrants | Romania | 4.8 /100 | #236 | Tragic 27.0% |
| Immigrants | Eastern Asia | 4.4 /100 | #237 | Tragic 27.1% |
| Osage | 4.4 /100 | #238 | Tragic 27.1% |
| Estonians | 4.3 /100 | #239 | Tragic 27.1% |
Demographics Similar to Immigrants from Sierra Leone by Wage/Income Gap
In terms of wage/income gap, the demographic groups most similar to Immigrants from Sierra Leone are Liberian (21.4%, a difference of 0.0%), Sierra Leonean (21.4%, a difference of 0.060%), Immigrants from Eritrea (21.4%, a difference of 0.080%), Lumbee (21.3%, a difference of 0.49%), and U.S. Virgin Islander (21.5%, a difference of 0.52%).
| Demographics | Rating | Rank | Wage/Income Gap |
| Somalis | 100.0 /100 | #35 | Exceptional 21.2% |
| Belizeans | 100.0 /100 | #36 | Exceptional 21.2% |
| Immigrants | Somalia | 100.0 /100 | #37 | Exceptional 21.2% |
| Immigrants | Belize | 100.0 /100 | #38 | Exceptional 21.3% |
| Colville | 100.0 /100 | #39 | Exceptional 21.3% |
| Lumbee | 100.0 /100 | #40 | Exceptional 21.3% |
| Liberians | 100.0 /100 | #41 | Exceptional 21.4% |
| Immigrants | Sierra Leone | 100.0 /100 | #42 | Exceptional 21.4% |
| Sierra Leoneans | 100.0 /100 | #43 | Exceptional 21.4% |
| Immigrants | Eritrea | 100.0 /100 | #44 | Exceptional 21.4% |
| U.S. Virgin Islanders | 100.0 /100 | #45 | Exceptional 21.5% |
| Immigrants | Ethiopia | 100.0 /100 | #46 | Exceptional 21.6% |
| Immigrants | Congo | 100.0 /100 | #47 | Exceptional 21.7% |
| Blacks/African Americans | 100.0 /100 | #48 | Exceptional 21.7% |
| Ethiopians | 100.0 /100 | #49 | Exceptional 21.8% |