Argentinean vs Eastern European Wage/Income Gap
COMPARE
Argentinean
Eastern European
Wage/Income Gap
Wage/Income Gap Comparison
Argentineans
Eastern Europeans
27.0%
WAGE/INCOME GAP
5.2/ 100
METRIC RATING
232nd/ 347
METRIC RANK
28.6%
WAGE/INCOME GAP
0.1/ 100
METRIC RATING
312th/ 347
METRIC RANK
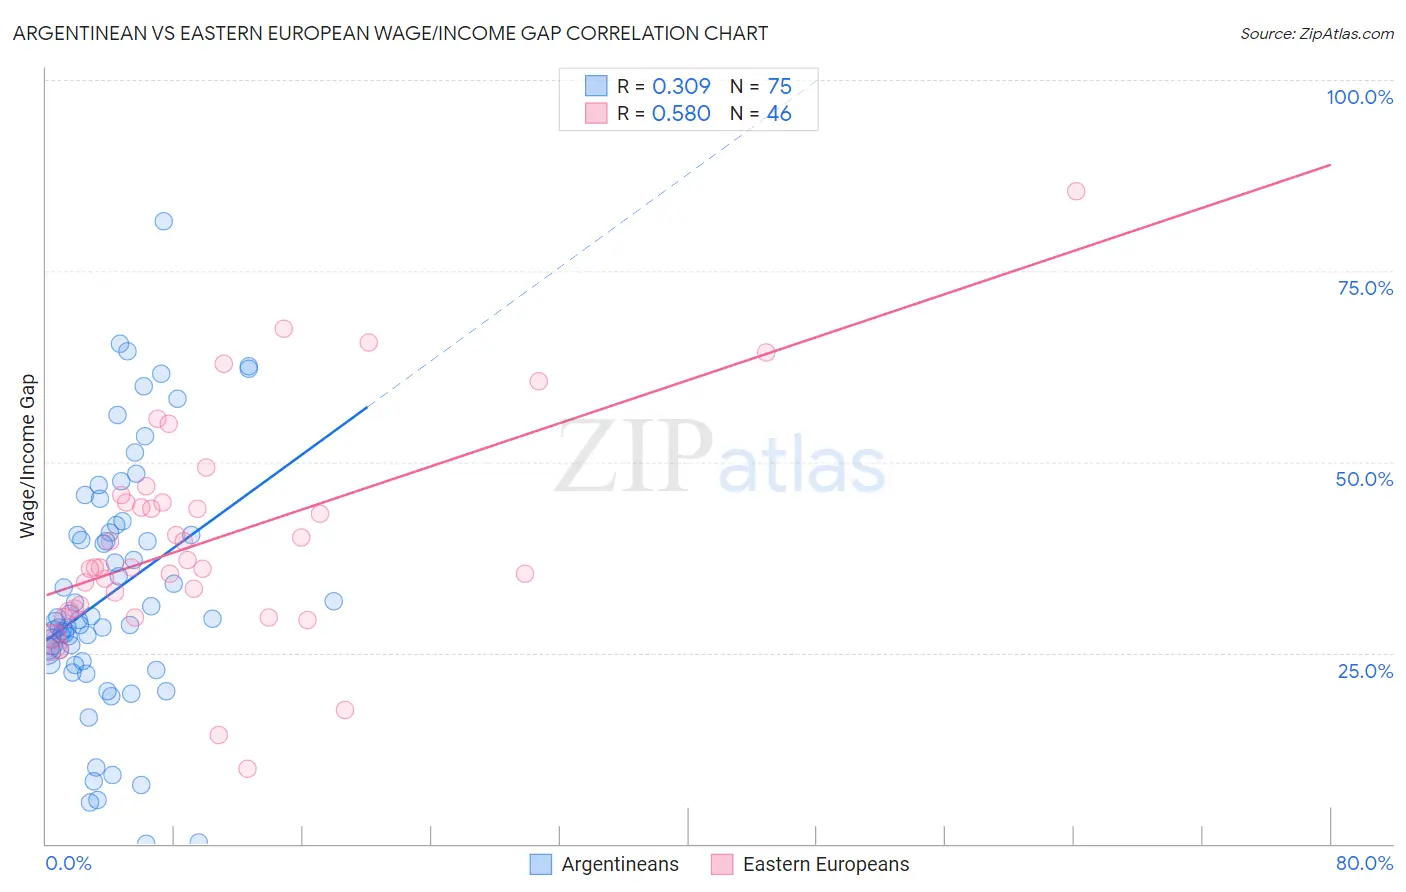
Argentinean vs Eastern European Wage/Income Gap Correlation Chart
The statistical analysis conducted on geographies consisting of 297,053,015 people shows a mild positive correlation between the proportion of Argentineans and wage/income gap percentage in the United States with a correlation coefficient (R) of 0.309 and weighted average of 27.0%. Similarly, the statistical analysis conducted on geographies consisting of 460,606,306 people shows a substantial positive correlation between the proportion of Eastern Europeans and wage/income gap percentage in the United States with a correlation coefficient (R) of 0.580 and weighted average of 28.6%, a difference of 6.1%.
Wage/Income Gap Correlation Summary
| Measurement | Argentinean | Eastern European |
| Minimum | 0.074% | 9.9% |
| Maximum | 81.5% | 85.4% |
| Range | 81.4% | 75.6% |
| Mean | 32.9% | 39.9% |
| Median | 29.2% | 36.2% |
| Interquartile 25% (IQ1) | 24.0% | 30.7% |
| Interquartile 75% (IQ3) | 40.7% | 44.6% |
| Interquartile Range (IQR) | 16.8% | 13.9% |
| Standard Deviation (Sample) | 16.2% | 14.4% |
| Standard Deviation (Population) | 16.1% | 14.3% |
Similar Demographics by Wage/Income Gap
Demographics Similar to Argentineans by Wage/Income Gap
In terms of wage/income gap, the demographic groups most similar to Argentineans are Bhutanese (27.0%, a difference of 0.020%), Ottawa (27.0%, a difference of 0.050%), Immigrants from Brazil (27.0%, a difference of 0.060%), Immigrants from Asia (27.0%, a difference of 0.10%), and Immigrants from Pakistan (27.0%, a difference of 0.11%).
| Demographics | Rating | Rank | Wage/Income Gap |
| Immigrants | Ireland | 6.5 /100 | #225 | Tragic 26.9% |
| Asians | 5.9 /100 | #226 | Tragic 26.9% |
| Spaniards | 5.6 /100 | #227 | Tragic 27.0% |
| Immigrants | Turkey | 5.6 /100 | #228 | Tragic 27.0% |
| Immigrants | Asia | 5.5 /100 | #229 | Tragic 27.0% |
| Ottawa | 5.3 /100 | #230 | Tragic 27.0% |
| Bhutanese | 5.3 /100 | #231 | Tragic 27.0% |
| Argentineans | 5.2 /100 | #232 | Tragic 27.0% |
| Immigrants | Brazil | 5.0 /100 | #233 | Tragic 27.0% |
| Immigrants | Pakistan | 4.9 /100 | #234 | Tragic 27.0% |
| Immigrants | Hungary | 4.8 /100 | #235 | Tragic 27.0% |
| Immigrants | Romania | 4.8 /100 | #236 | Tragic 27.0% |
| Immigrants | Eastern Asia | 4.4 /100 | #237 | Tragic 27.1% |
| Osage | 4.4 /100 | #238 | Tragic 27.1% |
| Estonians | 4.3 /100 | #239 | Tragic 27.1% |
Demographics Similar to Eastern Europeans by Wage/Income Gap
In terms of wage/income gap, the demographic groups most similar to Eastern Europeans are Immigrants from Lithuania (28.6%, a difference of 0.13%), French (28.7%, a difference of 0.13%), Finnish (28.6%, a difference of 0.20%), Immigrants from Scotland (28.7%, a difference of 0.27%), and Macedonian (28.6%, a difference of 0.29%).
| Demographics | Rating | Rank | Wage/Income Gap |
| Immigrants | South Africa | 0.1 /100 | #305 | Tragic 28.5% |
| Whites/Caucasians | 0.1 /100 | #306 | Tragic 28.5% |
| Immigrants | Denmark | 0.1 /100 | #307 | Tragic 28.5% |
| Poles | 0.1 /100 | #308 | Tragic 28.5% |
| Macedonians | 0.1 /100 | #309 | Tragic 28.6% |
| Finns | 0.1 /100 | #310 | Tragic 28.6% |
| Immigrants | Lithuania | 0.1 /100 | #311 | Tragic 28.6% |
| Eastern Europeans | 0.1 /100 | #312 | Tragic 28.6% |
| French | 0.1 /100 | #313 | Tragic 28.7% |
| Immigrants | Scotland | 0.1 /100 | #314 | Tragic 28.7% |
| Maltese | 0.1 /100 | #315 | Tragic 28.7% |
| Lithuanians | 0.1 /100 | #316 | Tragic 28.7% |
| Belgians | 0.1 /100 | #317 | Tragic 28.8% |
| Basques | 0.1 /100 | #318 | Tragic 28.8% |
| Slovaks | 0.1 /100 | #319 | Tragic 28.9% |