Arapaho vs Immigrants from Scotland In Labor Force | Age 16-19
COMPARE
Arapaho
Immigrants from Scotland
In Labor Force | Age 16-19
In Labor Force | Age 16-19 Comparison
Arapaho
Immigrants from Scotland
37.3%
IN LABOR FORCE | AGE 16-19
81.8/ 100
METRIC RATING
153rd/ 347
METRIC RANK
38.5%
IN LABOR FORCE | AGE 16-19
98.5/ 100
METRIC RATING
112th/ 347
METRIC RANK
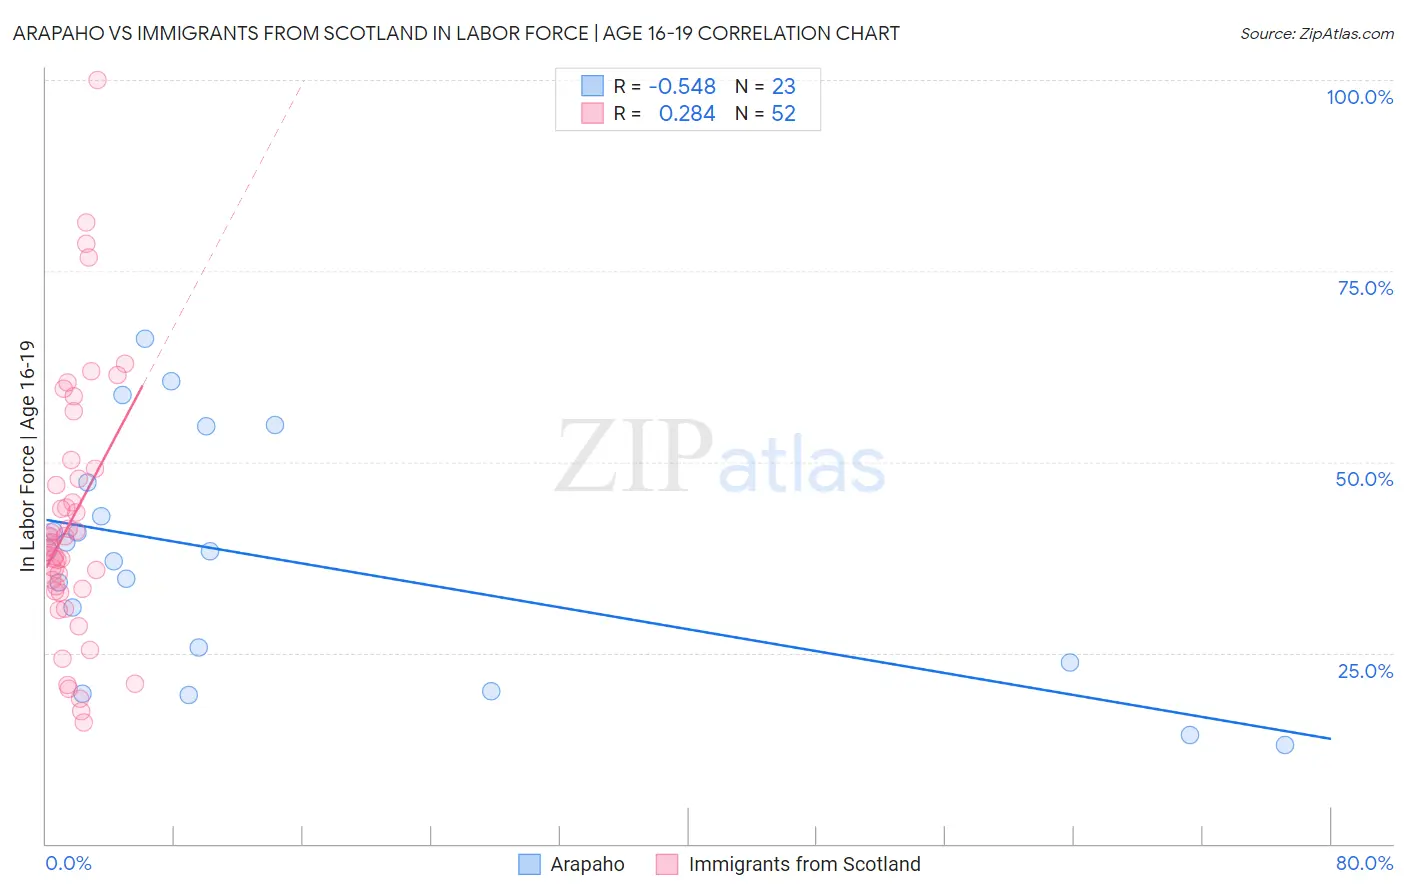
Arapaho vs Immigrants from Scotland In Labor Force | Age 16-19 Correlation Chart
The statistical analysis conducted on geographies consisting of 29,768,466 people shows a substantial negative correlation between the proportion of Arapaho and labor force participation rate among population between the ages 16 and 19 in the United States with a correlation coefficient (R) of -0.548 and weighted average of 37.3%. Similarly, the statistical analysis conducted on geographies consisting of 196,210,607 people shows a weak positive correlation between the proportion of Immigrants from Scotland and labor force participation rate among population between the ages 16 and 19 in the United States with a correlation coefficient (R) of 0.284 and weighted average of 38.5%, a difference of 3.3%.
In Labor Force | Age 16-19 Correlation Summary
| Measurement | Arapaho | Immigrants from Scotland |
| Minimum | 13.0% | 15.9% |
| Maximum | 66.1% | 100.0% |
| Range | 53.1% | 84.1% |
| Mean | 37.2% | 42.4% |
| Median | 38.3% | 39.3% |
| Interquartile 25% (IQ1) | 23.7% | 33.2% |
| Interquartile 75% (IQ3) | 47.3% | 48.5% |
| Interquartile Range (IQR) | 23.6% | 15.3% |
| Standard Deviation (Sample) | 15.1% | 17.1% |
| Standard Deviation (Population) | 14.8% | 16.9% |
Similar Demographics by In Labor Force | Age 16-19
Demographics Similar to Arapaho by In Labor Force | Age 16-19
In terms of in labor force | age 16-19, the demographic groups most similar to Arapaho are Immigrants from Bulgaria (37.3%, a difference of 0.020%), Immigrants from Lithuania (37.2%, a difference of 0.090%), Kiowa (37.2%, a difference of 0.12%), Immigrants from Sierra Leone (37.3%, a difference of 0.15%), and Immigrants from Poland (37.3%, a difference of 0.23%).
| Demographics | Rating | Rank | In Labor Force | Age 16-19 |
| Immigrants | Western Europe | 88.9 /100 | #146 | Excellent 37.5% |
| Brazilians | 88.7 /100 | #147 | Excellent 37.5% |
| Romanians | 87.3 /100 | #148 | Excellent 37.5% |
| Native Hawaiians | 85.0 /100 | #149 | Excellent 37.4% |
| Tsimshian | 84.7 /100 | #150 | Excellent 37.4% |
| Immigrants | Poland | 84.4 /100 | #151 | Excellent 37.3% |
| Immigrants | Sierra Leone | 83.6 /100 | #152 | Excellent 37.3% |
| Arapaho | 81.8 /100 | #153 | Excellent 37.3% |
| Immigrants | Bulgaria | 81.6 /100 | #154 | Excellent 37.3% |
| Immigrants | Lithuania | 80.7 /100 | #155 | Excellent 37.2% |
| Kiowa | 80.4 /100 | #156 | Excellent 37.2% |
| Immigrants | Brazil | 76.5 /100 | #157 | Good 37.1% |
| Ute | 75.7 /100 | #158 | Good 37.1% |
| Yaqui | 74.4 /100 | #159 | Good 37.1% |
| Immigrants | Saudi Arabia | 73.9 /100 | #160 | Good 37.0% |
Demographics Similar to Immigrants from Scotland by In Labor Force | Age 16-19
In terms of in labor force | age 16-19, the demographic groups most similar to Immigrants from Scotland are Crow (38.5%, a difference of 0.010%), Maltese (38.5%, a difference of 0.070%), Subsaharan African (38.4%, a difference of 0.13%), Lebanese (38.6%, a difference of 0.19%), and Immigrants from Ethiopia (38.6%, a difference of 0.20%).
| Demographics | Rating | Rank | In Labor Force | Age 16-19 |
| Iraqis | 98.9 /100 | #105 | Exceptional 38.6% |
| Delaware | 98.8 /100 | #106 | Exceptional 38.6% |
| Chinese | 98.8 /100 | #107 | Exceptional 38.6% |
| Immigrants | Ethiopia | 98.7 /100 | #108 | Exceptional 38.6% |
| Lebanese | 98.7 /100 | #109 | Exceptional 38.6% |
| Maltese | 98.6 /100 | #110 | Exceptional 38.5% |
| Crow | 98.5 /100 | #111 | Exceptional 38.5% |
| Immigrants | Scotland | 98.5 /100 | #112 | Exceptional 38.5% |
| Sub-Saharan Africans | 98.3 /100 | #113 | Exceptional 38.4% |
| Hawaiians | 98.2 /100 | #114 | Exceptional 38.4% |
| Bulgarians | 97.9 /100 | #115 | Exceptional 38.3% |
| Colville | 97.9 /100 | #116 | Exceptional 38.3% |
| Chickasaw | 97.8 /100 | #117 | Exceptional 38.3% |
| Immigrants | Nepal | 97.8 /100 | #118 | Exceptional 38.3% |
| Assyrians/Chaldeans/Syriacs | 97.8 /100 | #119 | Exceptional 38.3% |