Arapaho vs Immigrants from Brazil Householder Income Ages 45 - 64 years
COMPARE
Arapaho
Immigrants from Brazil
Householder Income Ages 45 - 64 years
Householder Income Ages 45 - 64 years Comparison
Arapaho
Immigrants from Brazil
$75,945
HOUSEHOLDER INCOME AGES 45 - 64 YEARS
0.0/ 100
METRIC RATING
336th/ 347
METRIC RANK
$106,470
HOUSEHOLDER INCOME AGES 45 - 64 YEARS
95.6/ 100
METRIC RATING
110th/ 347
METRIC RANK
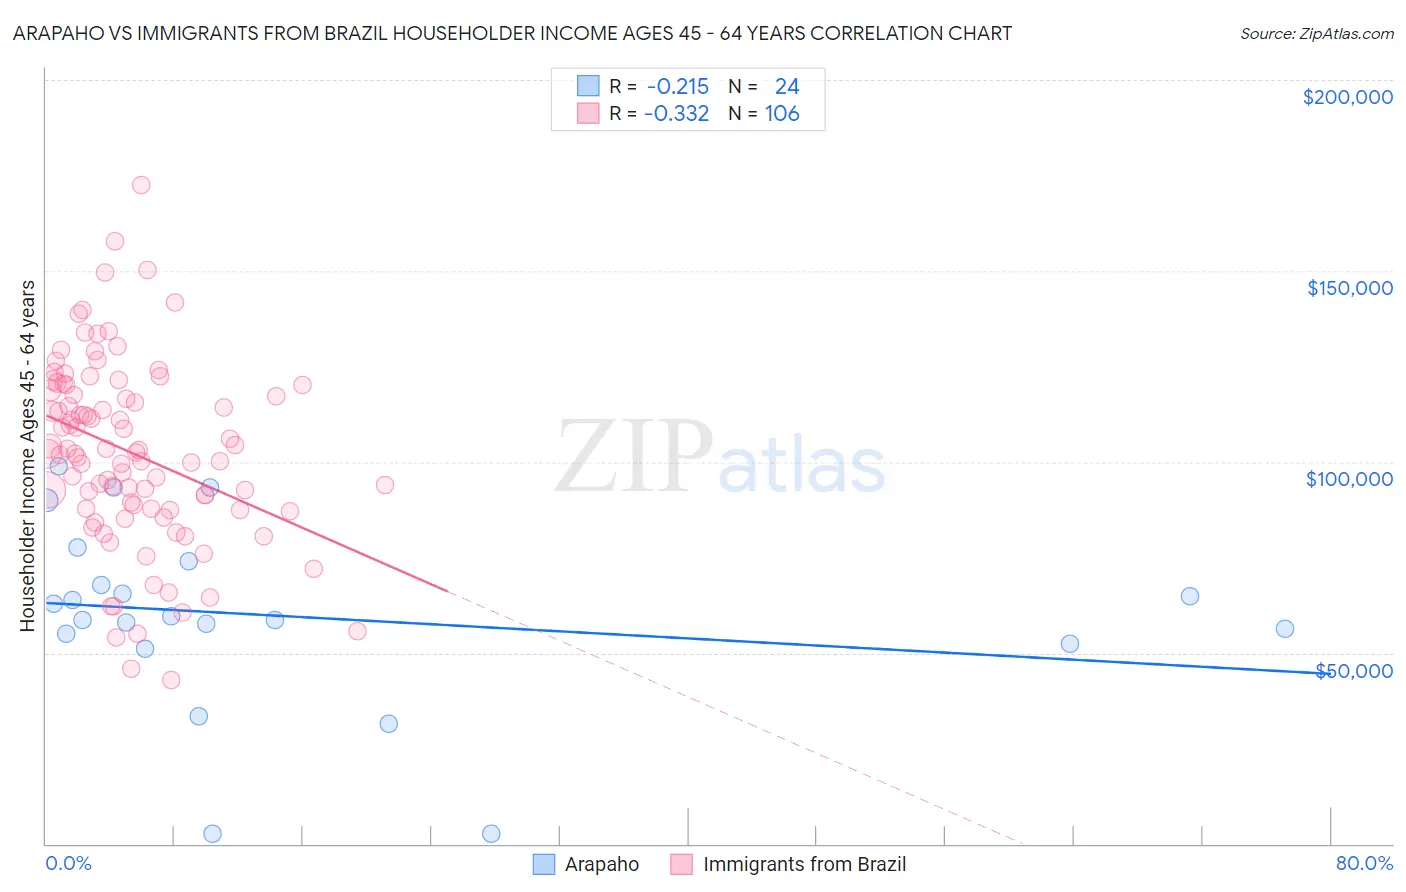
Arapaho vs Immigrants from Brazil Householder Income Ages 45 - 64 years Correlation Chart
The statistical analysis conducted on geographies consisting of 29,759,321 people shows a weak negative correlation between the proportion of Arapaho and household income with householder between the ages 45 and 64 in the United States with a correlation coefficient (R) of -0.215 and weighted average of $75,945. Similarly, the statistical analysis conducted on geographies consisting of 342,574,187 people shows a mild negative correlation between the proportion of Immigrants from Brazil and household income with householder between the ages 45 and 64 in the United States with a correlation coefficient (R) of -0.332 and weighted average of $106,470, a difference of 40.2%.
Householder Income Ages 45 - 64 years Correlation Summary
| Measurement | Arapaho | Immigrants from Brazil |
| Minimum | $2,499 | $42,860 |
| Maximum | $98,945 | $172,341 |
| Range | $96,446 | $129,481 |
| Mean | $59,533 | $102,398 |
| Median | $59,148 | $102,298 |
| Interquartile 25% (IQ1) | $53,794 | $87,781 |
| Interquartile 75% (IQ3) | $70,823 | $118,810 |
| Interquartile Range (IQR) | $17,029 | $31,029 |
| Standard Deviation (Sample) | $24,298 | $24,082 |
| Standard Deviation (Population) | $23,786 | $23,969 |
Similar Demographics by Householder Income Ages 45 - 64 years
Demographics Similar to Arapaho by Householder Income Ages 45 - 64 years
In terms of householder income ages 45 - 64 years, the demographic groups most similar to Arapaho are Pueblo ($75,601, a difference of 0.45%), Hopi ($75,562, a difference of 0.51%), Cheyenne ($76,362, a difference of 0.55%), Menominee ($76,903, a difference of 1.3%), and Kiowa ($74,815, a difference of 1.5%).
| Demographics | Rating | Rank | Householder Income Ages 45 - 64 years |
| Dutch West Indians | 0.0 /100 | #329 | Tragic $79,171 |
| Creek | 0.0 /100 | #330 | Tragic $78,960 |
| Immigrants | Dominican Republic | 0.0 /100 | #331 | Tragic $78,836 |
| Blacks/African Americans | 0.0 /100 | #332 | Tragic $78,556 |
| Immigrants | Congo | 0.0 /100 | #333 | Tragic $77,850 |
| Menominee | 0.0 /100 | #334 | Tragic $76,903 |
| Cheyenne | 0.0 /100 | #335 | Tragic $76,362 |
| Arapaho | 0.0 /100 | #336 | Tragic $75,945 |
| Pueblo | 0.0 /100 | #337 | Tragic $75,601 |
| Hopi | 0.0 /100 | #338 | Tragic $75,562 |
| Kiowa | 0.0 /100 | #339 | Tragic $74,815 |
| Immigrants | Yemen | 0.0 /100 | #340 | Tragic $74,575 |
| Crow | 0.0 /100 | #341 | Tragic $74,257 |
| Tohono O'odham | 0.0 /100 | #342 | Tragic $73,774 |
| Pima | 0.0 /100 | #343 | Tragic $73,365 |
Demographics Similar to Immigrants from Brazil by Householder Income Ages 45 - 64 years
In terms of householder income ages 45 - 64 years, the demographic groups most similar to Immigrants from Brazil are Immigrants from Vietnam ($106,417, a difference of 0.050%), Swedish ($106,377, a difference of 0.090%), European ($106,367, a difference of 0.10%), Chilean ($106,611, a difference of 0.13%), and Immigrants from Poland ($106,319, a difference of 0.14%).
| Demographics | Rating | Rank | Householder Income Ages 45 - 64 years |
| Syrians | 96.9 /100 | #103 | Exceptional $107,207 |
| Immigrants | Ukraine | 96.7 /100 | #104 | Exceptional $107,079 |
| Macedonians | 96.7 /100 | #105 | Exceptional $107,074 |
| Armenians | 96.6 /100 | #106 | Exceptional $107,002 |
| Immigrants | Fiji | 96.5 /100 | #107 | Exceptional $106,952 |
| Zimbabweans | 96.3 /100 | #108 | Exceptional $106,849 |
| Chileans | 95.9 /100 | #109 | Exceptional $106,611 |
| Immigrants | Brazil | 95.6 /100 | #110 | Exceptional $106,470 |
| Immigrants | Vietnam | 95.5 /100 | #111 | Exceptional $106,417 |
| Swedes | 95.4 /100 | #112 | Exceptional $106,377 |
| Europeans | 95.4 /100 | #113 | Exceptional $106,367 |
| Immigrants | Poland | 95.3 /100 | #114 | Exceptional $106,319 |
| Immigrants | Kuwait | 95.2 /100 | #115 | Exceptional $106,285 |
| British | 95.2 /100 | #116 | Exceptional $106,264 |
| Albanians | 95.1 /100 | #117 | Exceptional $106,243 |