Arapaho vs Scandinavian Householder Income Ages 45 - 64 years
COMPARE
Arapaho
Scandinavian
Householder Income Ages 45 - 64 years
Householder Income Ages 45 - 64 years Comparison
Arapaho
Scandinavians
$75,945
HOUSEHOLDER INCOME AGES 45 - 64 YEARS
0.0/ 100
METRIC RATING
336th/ 347
METRIC RANK
$102,969
HOUSEHOLDER INCOME AGES 45 - 64 YEARS
79.0/ 100
METRIC RATING
153rd/ 347
METRIC RANK
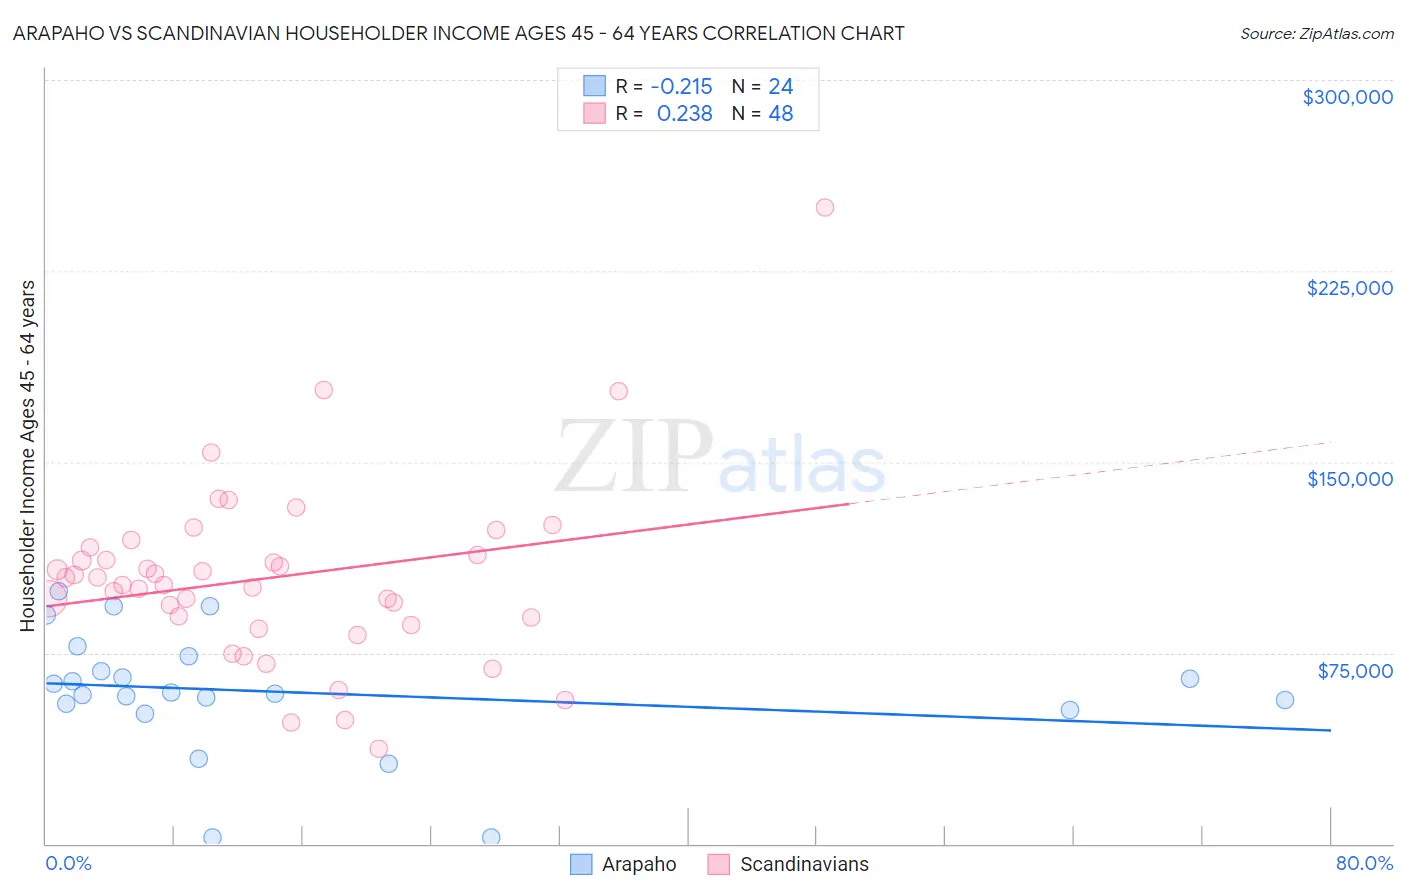
Arapaho vs Scandinavian Householder Income Ages 45 - 64 years Correlation Chart
The statistical analysis conducted on geographies consisting of 29,759,321 people shows a weak negative correlation between the proportion of Arapaho and household income with householder between the ages 45 and 64 in the United States with a correlation coefficient (R) of -0.215 and weighted average of $75,945. Similarly, the statistical analysis conducted on geographies consisting of 471,257,536 people shows a weak positive correlation between the proportion of Scandinavians and household income with householder between the ages 45 and 64 in the United States with a correlation coefficient (R) of 0.238 and weighted average of $102,969, a difference of 35.6%.
Householder Income Ages 45 - 64 years Correlation Summary
| Measurement | Arapaho | Scandinavian |
| Minimum | $2,499 | $37,396 |
| Maximum | $98,945 | $250,001 |
| Range | $96,446 | $212,605 |
| Mean | $59,533 | $104,566 |
| Median | $59,148 | $103,110 |
| Interquartile 25% (IQ1) | $53,794 | $87,340 |
| Interquartile 75% (IQ3) | $70,823 | $114,988 |
| Interquartile Range (IQR) | $17,029 | $27,648 |
| Standard Deviation (Sample) | $24,298 | $35,851 |
| Standard Deviation (Population) | $23,786 | $35,476 |
Similar Demographics by Householder Income Ages 45 - 64 years
Demographics Similar to Arapaho by Householder Income Ages 45 - 64 years
In terms of householder income ages 45 - 64 years, the demographic groups most similar to Arapaho are Pueblo ($75,601, a difference of 0.45%), Hopi ($75,562, a difference of 0.51%), Cheyenne ($76,362, a difference of 0.55%), Menominee ($76,903, a difference of 1.3%), and Kiowa ($74,815, a difference of 1.5%).
| Demographics | Rating | Rank | Householder Income Ages 45 - 64 years |
| Dutch West Indians | 0.0 /100 | #329 | Tragic $79,171 |
| Creek | 0.0 /100 | #330 | Tragic $78,960 |
| Immigrants | Dominican Republic | 0.0 /100 | #331 | Tragic $78,836 |
| Blacks/African Americans | 0.0 /100 | #332 | Tragic $78,556 |
| Immigrants | Congo | 0.0 /100 | #333 | Tragic $77,850 |
| Menominee | 0.0 /100 | #334 | Tragic $76,903 |
| Cheyenne | 0.0 /100 | #335 | Tragic $76,362 |
| Arapaho | 0.0 /100 | #336 | Tragic $75,945 |
| Pueblo | 0.0 /100 | #337 | Tragic $75,601 |
| Hopi | 0.0 /100 | #338 | Tragic $75,562 |
| Kiowa | 0.0 /100 | #339 | Tragic $74,815 |
| Immigrants | Yemen | 0.0 /100 | #340 | Tragic $74,575 |
| Crow | 0.0 /100 | #341 | Tragic $74,257 |
| Tohono O'odham | 0.0 /100 | #342 | Tragic $73,774 |
| Pima | 0.0 /100 | #343 | Tragic $73,365 |
Demographics Similar to Scandinavians by Householder Income Ages 45 - 64 years
In terms of householder income ages 45 - 64 years, the demographic groups most similar to Scandinavians are Slovene ($102,885, a difference of 0.080%), Irish ($103,067, a difference of 0.090%), Swiss ($103,071, a difference of 0.10%), Costa Rican ($102,779, a difference of 0.19%), and Carpatho Rusyn ($102,777, a difference of 0.19%).
| Demographics | Rating | Rank | Householder Income Ages 45 - 64 years |
| Immigrants | Chile | 82.5 /100 | #146 | Excellent $103,412 |
| Basques | 82.3 /100 | #147 | Excellent $103,387 |
| Immigrants | Germany | 81.5 /100 | #148 | Excellent $103,282 |
| Immigrants | Sierra Leone | 81.1 /100 | #149 | Excellent $103,227 |
| Immigrants | Peru | 80.7 /100 | #150 | Excellent $103,173 |
| Swiss | 79.9 /100 | #151 | Good $103,071 |
| Irish | 79.8 /100 | #152 | Good $103,067 |
| Scandinavians | 79.0 /100 | #153 | Good $102,969 |
| Slovenes | 78.3 /100 | #154 | Good $102,885 |
| Costa Ricans | 77.4 /100 | #155 | Good $102,779 |
| Carpatho Rusyns | 77.4 /100 | #156 | Good $102,777 |
| Immigrants | Ethiopia | 77.3 /100 | #157 | Good $102,763 |
| Slavs | 76.1 /100 | #158 | Good $102,629 |
| Sierra Leoneans | 74.2 /100 | #159 | Good $102,427 |
| Icelanders | 72.5 /100 | #160 | Good $102,261 |