Arapaho vs Moroccan Householder Income Ages 45 - 64 years
COMPARE
Arapaho
Moroccan
Householder Income Ages 45 - 64 years
Householder Income Ages 45 - 64 years Comparison
Arapaho
Moroccans
$75,945
HOUSEHOLDER INCOME AGES 45 - 64 YEARS
0.0/ 100
METRIC RATING
336th/ 347
METRIC RANK
$100,138
HOUSEHOLDER INCOME AGES 45 - 64 YEARS
47.7/ 100
METRIC RATING
177th/ 347
METRIC RANK
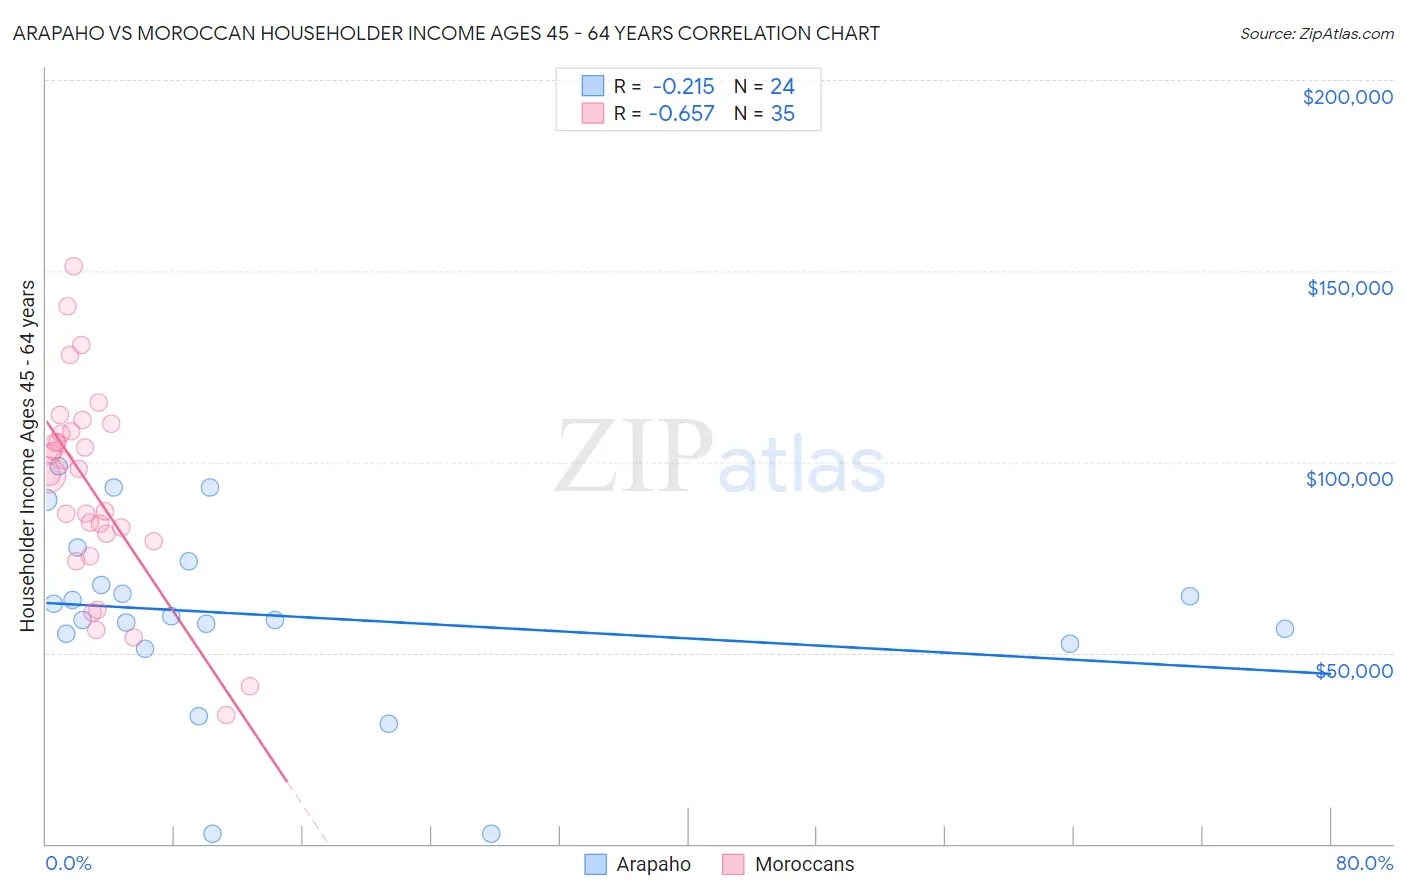
Arapaho vs Moroccan Householder Income Ages 45 - 64 years Correlation Chart
The statistical analysis conducted on geographies consisting of 29,759,321 people shows a weak negative correlation between the proportion of Arapaho and household income with householder between the ages 45 and 64 in the United States with a correlation coefficient (R) of -0.215 and weighted average of $75,945. Similarly, the statistical analysis conducted on geographies consisting of 201,649,728 people shows a significant negative correlation between the proportion of Moroccans and household income with householder between the ages 45 and 64 in the United States with a correlation coefficient (R) of -0.657 and weighted average of $100,138, a difference of 31.9%.
Householder Income Ages 45 - 64 years Correlation Summary
| Measurement | Arapaho | Moroccan |
| Minimum | $2,499 | $33,750 |
| Maximum | $98,945 | $151,275 |
| Range | $96,446 | $117,525 |
| Mean | $59,533 | $92,917 |
| Median | $59,148 | $96,708 |
| Interquartile 25% (IQ1) | $53,794 | $79,167 |
| Interquartile 75% (IQ3) | $70,823 | $108,085 |
| Interquartile Range (IQR) | $17,029 | $28,918 |
| Standard Deviation (Sample) | $24,298 | $26,273 |
| Standard Deviation (Population) | $23,786 | $25,895 |
Similar Demographics by Householder Income Ages 45 - 64 years
Demographics Similar to Arapaho by Householder Income Ages 45 - 64 years
In terms of householder income ages 45 - 64 years, the demographic groups most similar to Arapaho are Pueblo ($75,601, a difference of 0.45%), Hopi ($75,562, a difference of 0.51%), Cheyenne ($76,362, a difference of 0.55%), Menominee ($76,903, a difference of 1.3%), and Kiowa ($74,815, a difference of 1.5%).
| Demographics | Rating | Rank | Householder Income Ages 45 - 64 years |
| Dutch West Indians | 0.0 /100 | #329 | Tragic $79,171 |
| Creek | 0.0 /100 | #330 | Tragic $78,960 |
| Immigrants | Dominican Republic | 0.0 /100 | #331 | Tragic $78,836 |
| Blacks/African Americans | 0.0 /100 | #332 | Tragic $78,556 |
| Immigrants | Congo | 0.0 /100 | #333 | Tragic $77,850 |
| Menominee | 0.0 /100 | #334 | Tragic $76,903 |
| Cheyenne | 0.0 /100 | #335 | Tragic $76,362 |
| Arapaho | 0.0 /100 | #336 | Tragic $75,945 |
| Pueblo | 0.0 /100 | #337 | Tragic $75,601 |
| Hopi | 0.0 /100 | #338 | Tragic $75,562 |
| Kiowa | 0.0 /100 | #339 | Tragic $74,815 |
| Immigrants | Yemen | 0.0 /100 | #340 | Tragic $74,575 |
| Crow | 0.0 /100 | #341 | Tragic $74,257 |
| Tohono O'odham | 0.0 /100 | #342 | Tragic $73,774 |
| Pima | 0.0 /100 | #343 | Tragic $73,365 |
Demographics Similar to Moroccans by Householder Income Ages 45 - 64 years
In terms of householder income ages 45 - 64 years, the demographic groups most similar to Moroccans are Immigrants from Costa Rica ($100,141, a difference of 0.0%), Immigrants from Cameroon ($100,084, a difference of 0.050%), Belgian ($100,060, a difference of 0.080%), German ($100,224, a difference of 0.090%), and Aleut ($100,052, a difference of 0.090%).
| Demographics | Rating | Rank | Householder Income Ages 45 - 64 years |
| Slovaks | 58.8 /100 | #170 | Average $101,029 |
| South Americans | 56.4 /100 | #171 | Average $100,837 |
| Immigrants | Uzbekistan | 52.5 /100 | #172 | Average $100,523 |
| Alsatians | 51.4 /100 | #173 | Average $100,435 |
| Welsh | 50.0 /100 | #174 | Average $100,322 |
| Germans | 48.8 /100 | #175 | Average $100,224 |
| Immigrants | Costa Rica | 47.7 /100 | #176 | Average $100,141 |
| Moroccans | 47.7 /100 | #177 | Average $100,138 |
| Immigrants | Cameroon | 47.0 /100 | #178 | Average $100,084 |
| Belgians | 46.7 /100 | #179 | Average $100,060 |
| Aleuts | 46.6 /100 | #180 | Average $100,052 |
| Immigrants | Immigrants | 45.3 /100 | #181 | Average $99,943 |
| Finns | 44.8 /100 | #182 | Average $99,904 |
| Spaniards | 44.6 /100 | #183 | Average $99,889 |
| French | 43.8 /100 | #184 | Average $99,824 |