Immigrants from Barbados vs Immigrants from Chile Median Family Income
COMPARE
Immigrants from Barbados
Immigrants from Chile
Median Family Income
Median Family Income Comparison
Immigrants from Barbados
Immigrants from Chile
$92,419
MEDIAN FAMILY INCOME
0.5/ 100
METRIC RATING
254th/ 347
METRIC RANK
$105,655
MEDIAN FAMILY INCOME
82.1/ 100
METRIC RATING
147th/ 347
METRIC RANK
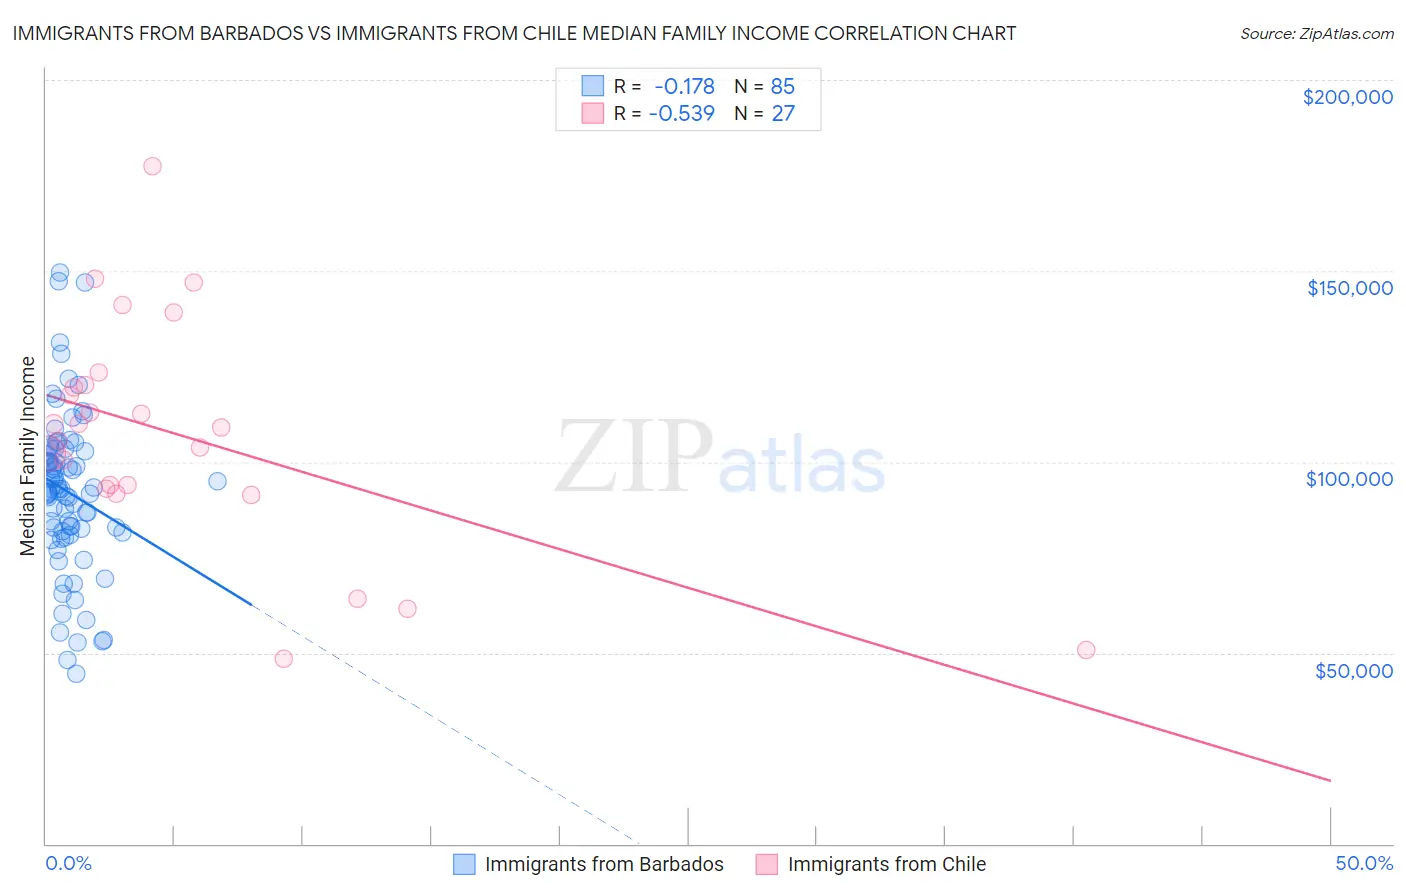
Immigrants from Barbados vs Immigrants from Chile Median Family Income Correlation Chart
The statistical analysis conducted on geographies consisting of 112,740,718 people shows a poor negative correlation between the proportion of Immigrants from Barbados and median family income in the United States with a correlation coefficient (R) of -0.178 and weighted average of $92,419. Similarly, the statistical analysis conducted on geographies consisting of 218,577,241 people shows a substantial negative correlation between the proportion of Immigrants from Chile and median family income in the United States with a correlation coefficient (R) of -0.539 and weighted average of $105,655, a difference of 14.3%.
Median Family Income Correlation Summary
| Measurement | Immigrants from Barbados | Immigrants from Chile |
| Minimum | $44,554 | $48,403 |
| Maximum | $149,653 | $177,440 |
| Range | $105,099 | $129,037 |
| Mean | $92,071 | $106,979 |
| Median | $92,856 | $109,000 |
| Interquartile 25% (IQ1) | $81,708 | $92,919 |
| Interquartile 75% (IQ3) | $103,000 | $120,092 |
| Interquartile Range (IQR) | $21,293 | $27,173 |
| Standard Deviation (Sample) | $20,843 | $29,634 |
| Standard Deviation (Population) | $20,721 | $29,080 |
Similar Demographics by Median Family Income
Demographics Similar to Immigrants from Barbados by Median Family Income
In terms of median family income, the demographic groups most similar to Immigrants from Barbados are Immigrants from Guyana ($92,513, a difference of 0.10%), Immigrants from El Salvador ($92,545, a difference of 0.14%), Immigrants from Laos ($92,239, a difference of 0.20%), Nicaraguan ($92,231, a difference of 0.20%), and Immigrants from Somalia ($92,609, a difference of 0.21%).
| Demographics | Rating | Rank | Median Family Income |
| Immigrants | Senegal | 0.7 /100 | #247 | Tragic $92,912 |
| French American Indians | 0.7 /100 | #248 | Tragic $92,872 |
| Immigrants | Ecuador | 0.7 /100 | #249 | Tragic $92,837 |
| West Indians | 0.6 /100 | #250 | Tragic $92,765 |
| Immigrants | Somalia | 0.6 /100 | #251 | Tragic $92,609 |
| Immigrants | El Salvador | 0.6 /100 | #252 | Tragic $92,545 |
| Immigrants | Guyana | 0.6 /100 | #253 | Tragic $92,513 |
| Immigrants | Barbados | 0.5 /100 | #254 | Tragic $92,419 |
| Immigrants | Laos | 0.5 /100 | #255 | Tragic $92,239 |
| Nicaraguans | 0.5 /100 | #256 | Tragic $92,231 |
| Americans | 0.4 /100 | #257 | Tragic $92,096 |
| Osage | 0.4 /100 | #258 | Tragic $91,926 |
| Cape Verdeans | 0.4 /100 | #259 | Tragic $91,848 |
| Pennsylvania Germans | 0.4 /100 | #260 | Tragic $91,763 |
| Inupiat | 0.4 /100 | #261 | Tragic $91,730 |
Demographics Similar to Immigrants from Chile by Median Family Income
In terms of median family income, the demographic groups most similar to Immigrants from Chile are Hungarian ($105,609, a difference of 0.040%), Immigrants from Germany ($105,507, a difference of 0.14%), Czech ($105,839, a difference of 0.17%), Irish ($105,453, a difference of 0.19%), and Peruvian ($105,444, a difference of 0.20%).
| Demographics | Rating | Rank | Median Family Income |
| Norwegians | 85.5 /100 | #140 | Excellent $106,144 |
| Immigrants | Syria | 85.3 /100 | #141 | Excellent $106,118 |
| Slovenes | 84.7 /100 | #142 | Excellent $106,020 |
| Tongans | 84.3 /100 | #143 | Excellent $105,967 |
| Immigrants | Morocco | 84.3 /100 | #144 | Excellent $105,964 |
| Danes | 83.8 /100 | #145 | Excellent $105,900 |
| Czechs | 83.4 /100 | #146 | Excellent $105,839 |
| Immigrants | Chile | 82.1 /100 | #147 | Excellent $105,655 |
| Hungarians | 81.7 /100 | #148 | Excellent $105,609 |
| Immigrants | Germany | 80.9 /100 | #149 | Excellent $105,507 |
| Irish | 80.5 /100 | #150 | Excellent $105,453 |
| Peruvians | 80.4 /100 | #151 | Excellent $105,444 |
| Immigrants | Albania | 79.1 /100 | #152 | Good $105,285 |
| Slavs | 77.9 /100 | #153 | Good $105,144 |
| Immigrants | Nepal | 76.3 /100 | #154 | Good $104,966 |