Arapaho vs Immigrants from Southern Europe Median Male Earnings
COMPARE
Arapaho
Immigrants from Southern Europe
Median Male Earnings
Median Male Earnings Comparison
Arapaho
Immigrants from Southern Europe
$41,758
MEDIAN MALE EARNINGS
0.0/ 100
METRIC RATING
342nd/ 347
METRIC RANK
$59,217
MEDIAN MALE EARNINGS
99.0/ 100
METRIC RATING
93rd/ 347
METRIC RANK
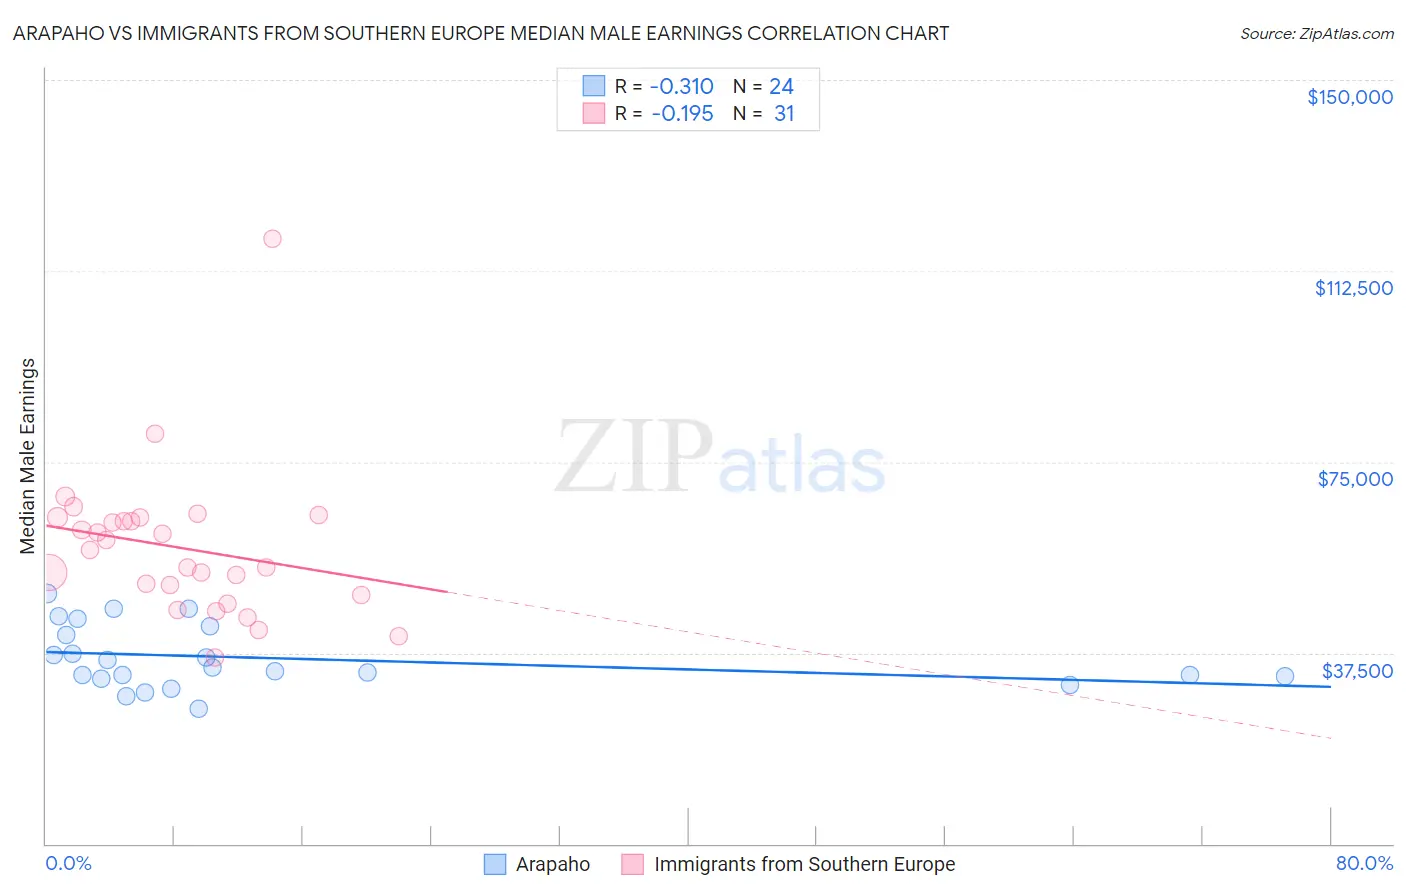
Arapaho vs Immigrants from Southern Europe Median Male Earnings Correlation Chart
The statistical analysis conducted on geographies consisting of 29,771,934 people shows a mild negative correlation between the proportion of Arapaho and median male earnings in the United States with a correlation coefficient (R) of -0.310 and weighted average of $41,758. Similarly, the statistical analysis conducted on geographies consisting of 402,658,889 people shows a poor negative correlation between the proportion of Immigrants from Southern Europe and median male earnings in the United States with a correlation coefficient (R) of -0.195 and weighted average of $59,217, a difference of 41.8%.
Median Male Earnings Correlation Summary
| Measurement | Arapaho | Immigrants from Southern Europe |
| Minimum | $26,527 | $36,498 |
| Maximum | $49,176 | $118,929 |
| Range | $22,649 | $82,431 |
| Mean | $36,456 | $58,166 |
| Median | $34,270 | $57,777 |
| Interquartile 25% (IQ1) | $32,621 | $48,947 |
| Interquartile 75% (IQ3) | $41,897 | $63,998 |
| Interquartile Range (IQR) | $9,276 | $15,051 |
| Standard Deviation (Sample) | $6,211 | $14,794 |
| Standard Deviation (Population) | $6,080 | $14,553 |
Similar Demographics by Median Male Earnings
Demographics Similar to Arapaho by Median Male Earnings
In terms of median male earnings, the demographic groups most similar to Arapaho are Lumbee ($41,715, a difference of 0.10%), Hopi ($42,060, a difference of 0.72%), Navajo ($42,098, a difference of 0.81%), Pueblo ($41,314, a difference of 1.1%), and Pima ($42,357, a difference of 1.4%).
| Demographics | Rating | Rank | Median Male Earnings |
| Immigrants | Congo | 0.0 /100 | #333 | Tragic $44,204 |
| Immigrants | Yemen | 0.0 /100 | #334 | Tragic $44,083 |
| Spanish American Indians | 0.0 /100 | #335 | Tragic $44,010 |
| Immigrants | Cuba | 0.0 /100 | #336 | Tragic $43,461 |
| Menominee | 0.0 /100 | #337 | Tragic $42,581 |
| Crow | 0.0 /100 | #338 | Tragic $42,434 |
| Pima | 0.0 /100 | #339 | Tragic $42,357 |
| Navajo | 0.0 /100 | #340 | Tragic $42,098 |
| Hopi | 0.0 /100 | #341 | Tragic $42,060 |
| Arapaho | 0.0 /100 | #342 | Tragic $41,758 |
| Lumbee | 0.0 /100 | #343 | Tragic $41,715 |
| Pueblo | 0.0 /100 | #344 | Tragic $41,314 |
| Puerto Ricans | 0.0 /100 | #345 | Tragic $40,071 |
| Tohono O'odham | 0.0 /100 | #346 | Tragic $39,543 |
| Yup'ik | 0.0 /100 | #347 | Tragic $39,504 |
Demographics Similar to Immigrants from Southern Europe by Median Male Earnings
In terms of median male earnings, the demographic groups most similar to Immigrants from Southern Europe are Immigrants from North Macedonia ($59,189, a difference of 0.050%), Immigrants from Kazakhstan ($59,278, a difference of 0.10%), Laotian ($59,351, a difference of 0.23%), Austrian ($59,359, a difference of 0.24%), and Immigrants from Moldova ($59,417, a difference of 0.34%).
| Demographics | Rating | Rank | Median Male Earnings |
| Immigrants | England | 99.3 /100 | #86 | Exceptional $59,527 |
| Macedonians | 99.3 /100 | #87 | Exceptional $59,522 |
| Immigrants | Argentina | 99.3 /100 | #88 | Exceptional $59,491 |
| Immigrants | Moldova | 99.2 /100 | #89 | Exceptional $59,417 |
| Austrians | 99.2 /100 | #90 | Exceptional $59,359 |
| Laotians | 99.2 /100 | #91 | Exceptional $59,351 |
| Immigrants | Kazakhstan | 99.1 /100 | #92 | Exceptional $59,278 |
| Immigrants | Southern Europe | 99.0 /100 | #93 | Exceptional $59,217 |
| Immigrants | North Macedonia | 99.0 /100 | #94 | Exceptional $59,189 |
| Immigrants | Lebanon | 98.6 /100 | #95 | Exceptional $58,835 |
| Albanians | 98.4 /100 | #96 | Exceptional $58,680 |
| Northern Europeans | 98.2 /100 | #97 | Exceptional $58,588 |
| Jordanians | 98.1 /100 | #98 | Exceptional $58,500 |
| Immigrants | Poland | 98.0 /100 | #99 | Exceptional $58,452 |
| Assyrians/Chaldeans/Syriacs | 97.9 /100 | #100 | Exceptional $58,437 |