French vs Immigrants from Asia Median Family Income
COMPARE
French
Immigrants from Asia
Median Family Income
Median Family Income Comparison
French
Immigrants from Asia
$102,368
MEDIAN FAMILY INCOME
46.1/ 100
METRIC RATING
176th/ 347
METRIC RANK
$118,291
MEDIAN FAMILY INCOME
100.0/ 100
METRIC RATING
39th/ 347
METRIC RANK
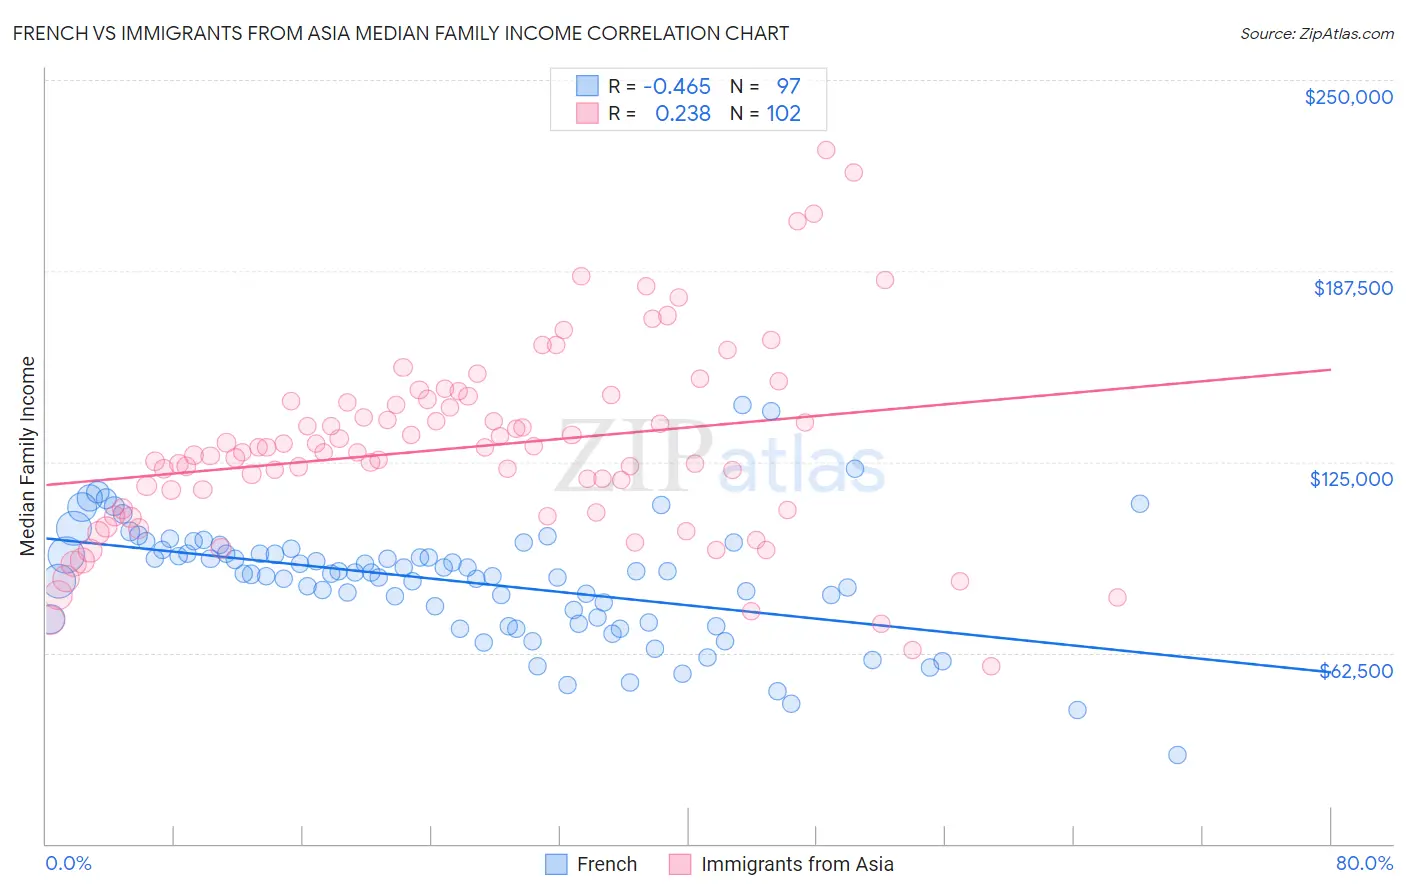
French vs Immigrants from Asia Median Family Income Correlation Chart
The statistical analysis conducted on geographies consisting of 571,052,079 people shows a moderate negative correlation between the proportion of French and median family income in the United States with a correlation coefficient (R) of -0.465 and weighted average of $102,368. Similarly, the statistical analysis conducted on geographies consisting of 548,079,334 people shows a weak positive correlation between the proportion of Immigrants from Asia and median family income in the United States with a correlation coefficient (R) of 0.238 and weighted average of $118,291, a difference of 15.5%.
Median Family Income Correlation Summary
| Measurement | French | Immigrants from Asia |
| Minimum | $29,018 | $58,163 |
| Maximum | $143,457 | $227,279 |
| Range | $114,439 | $169,116 |
| Mean | $85,989 | $129,737 |
| Median | $88,473 | $128,095 |
| Interquartile 25% (IQ1) | $72,966 | $109,196 |
| Interquartile 75% (IQ3) | $95,475 | $144,788 |
| Interquartile Range (IQR) | $22,509 | $35,592 |
| Standard Deviation (Sample) | $19,163 | $31,368 |
| Standard Deviation (Population) | $19,064 | $31,213 |
Similar Demographics by Median Family Income
Demographics Similar to French by Median Family Income
In terms of median family income, the demographic groups most similar to French are Immigrants from Eastern Africa ($102,451, a difference of 0.080%), German ($102,254, a difference of 0.11%), Welsh ($102,151, a difference of 0.21%), Finnish ($102,676, a difference of 0.30%), and Belgian ($102,788, a difference of 0.41%).
| Demographics | Rating | Rank | Median Family Income |
| Czechoslovakians | 57.6 /100 | #169 | Average $103,273 |
| Immigrants | Uzbekistan | 56.6 /100 | #170 | Average $103,197 |
| Alsatians | 54.3 /100 | #171 | Average $103,010 |
| Immigrants | Eritrea | 51.9 /100 | #172 | Average $102,823 |
| Belgians | 51.4 /100 | #173 | Average $102,788 |
| Finns | 50.0 /100 | #174 | Average $102,676 |
| Immigrants | Eastern Africa | 47.1 /100 | #175 | Average $102,451 |
| French | 46.1 /100 | #176 | Average $102,368 |
| Germans | 44.6 /100 | #177 | Average $102,254 |
| Welsh | 43.3 /100 | #178 | Average $102,151 |
| South Americans | 39.7 /100 | #179 | Fair $101,856 |
| French Canadians | 37.0 /100 | #180 | Fair $101,634 |
| Spaniards | 36.8 /100 | #181 | Fair $101,617 |
| Tsimshian | 35.9 /100 | #182 | Fair $101,543 |
| Kenyans | 34.5 /100 | #183 | Fair $101,417 |
Demographics Similar to Immigrants from Asia by Median Family Income
In terms of median family income, the demographic groups most similar to Immigrants from Asia are Immigrants from Turkey ($118,325, a difference of 0.030%), Australian ($118,440, a difference of 0.13%), Immigrants from Lithuania ($118,053, a difference of 0.20%), Israeli ($118,577, a difference of 0.24%), and Estonian ($118,013, a difference of 0.24%).
| Demographics | Rating | Rank | Median Family Income |
| Asians | 100.0 /100 | #32 | Exceptional $119,955 |
| Bhutanese | 100.0 /100 | #33 | Exceptional $119,800 |
| Bolivians | 100.0 /100 | #34 | Exceptional $119,479 |
| Soviet Union | 100.0 /100 | #35 | Exceptional $119,262 |
| Israelis | 100.0 /100 | #36 | Exceptional $118,577 |
| Australians | 100.0 /100 | #37 | Exceptional $118,440 |
| Immigrants | Turkey | 100.0 /100 | #38 | Exceptional $118,325 |
| Immigrants | Asia | 100.0 /100 | #39 | Exceptional $118,291 |
| Immigrants | Lithuania | 100.0 /100 | #40 | Exceptional $118,053 |
| Estonians | 100.0 /100 | #41 | Exceptional $118,013 |
| Immigrants | Bolivia | 100.0 /100 | #42 | Exceptional $117,912 |
| Bulgarians | 100.0 /100 | #43 | Exceptional $117,818 |
| Cambodians | 100.0 /100 | #44 | Exceptional $117,780 |
| Immigrants | Greece | 99.9 /100 | #45 | Exceptional $117,344 |
| Immigrants | Russia | 99.9 /100 | #46 | Exceptional $116,942 |