Immigrants from South Eastern Asia vs Immigrants from Asia Median Family Income
COMPARE
Immigrants from South Eastern Asia
Immigrants from Asia
Median Family Income
Median Family Income Comparison
Immigrants from South Eastern Asia
Immigrants from Asia
$106,252
MEDIAN FAMILY INCOME
86.1/ 100
METRIC RATING
136th/ 347
METRIC RANK
$118,291
MEDIAN FAMILY INCOME
100.0/ 100
METRIC RATING
39th/ 347
METRIC RANK
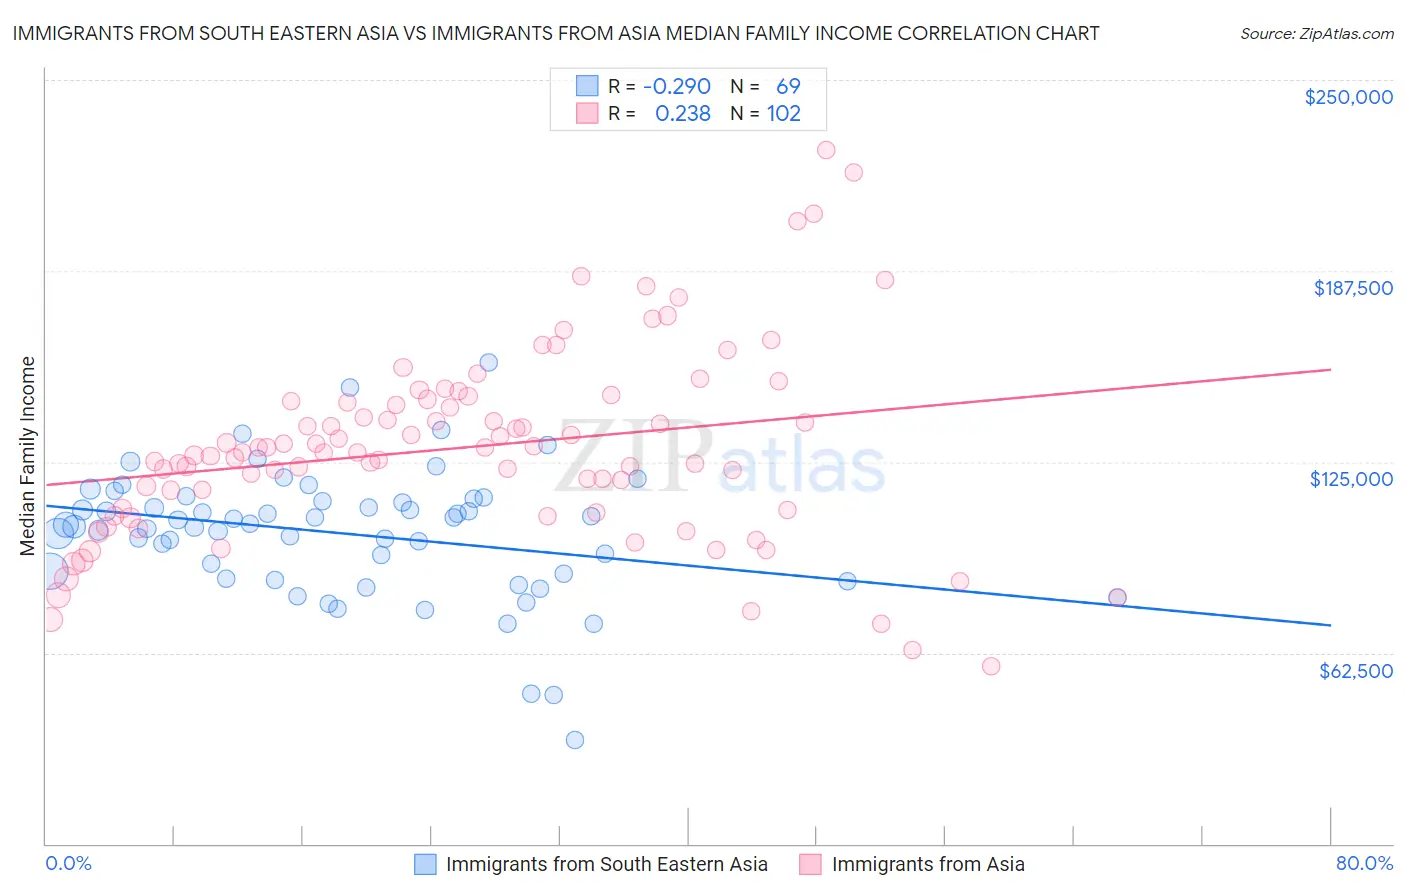
Immigrants from South Eastern Asia vs Immigrants from Asia Median Family Income Correlation Chart
The statistical analysis conducted on geographies consisting of 511,889,234 people shows a weak negative correlation between the proportion of Immigrants from South Eastern Asia and median family income in the United States with a correlation coefficient (R) of -0.290 and weighted average of $106,252. Similarly, the statistical analysis conducted on geographies consisting of 548,079,334 people shows a weak positive correlation between the proportion of Immigrants from Asia and median family income in the United States with a correlation coefficient (R) of 0.238 and weighted average of $118,291, a difference of 11.3%.
Median Family Income Correlation Summary
| Measurement | Immigrants from South Eastern Asia | Immigrants from Asia |
| Minimum | $34,076 | $58,163 |
| Maximum | $157,444 | $227,279 |
| Range | $123,368 | $169,116 |
| Mean | $101,571 | $129,737 |
| Median | $104,465 | $128,095 |
| Interquartile 25% (IQ1) | $87,571 | $109,196 |
| Interquartile 75% (IQ3) | $112,620 | $144,788 |
| Interquartile Range (IQR) | $25,049 | $35,592 |
| Standard Deviation (Sample) | $21,051 | $31,368 |
| Standard Deviation (Population) | $20,898 | $31,213 |
Similar Demographics by Median Family Income
Demographics Similar to Immigrants from South Eastern Asia by Median Family Income
In terms of median family income, the demographic groups most similar to Immigrants from South Eastern Asia are Portuguese ($106,286, a difference of 0.030%), Immigrants from Uganda ($106,188, a difference of 0.060%), Immigrants from Vietnam ($106,186, a difference of 0.060%), Luxembourger ($106,183, a difference of 0.060%), and Norwegian ($106,144, a difference of 0.10%).
| Demographics | Rating | Rank | Median Family Income |
| Arabs | 89.9 /100 | #129 | Excellent $106,952 |
| Brazilians | 89.8 /100 | #130 | Excellent $106,942 |
| Canadians | 88.1 /100 | #131 | Excellent $106,597 |
| Immigrants | Fiji | 87.8 /100 | #132 | Excellent $106,544 |
| Ugandans | 87.8 /100 | #133 | Excellent $106,541 |
| Immigrants | Oceania | 87.3 /100 | #134 | Excellent $106,453 |
| Portuguese | 86.3 /100 | #135 | Excellent $106,286 |
| Immigrants | South Eastern Asia | 86.1 /100 | #136 | Excellent $106,252 |
| Immigrants | Uganda | 85.7 /100 | #137 | Excellent $106,188 |
| Immigrants | Vietnam | 85.7 /100 | #138 | Excellent $106,186 |
| Luxembourgers | 85.7 /100 | #139 | Excellent $106,183 |
| Norwegians | 85.5 /100 | #140 | Excellent $106,144 |
| Immigrants | Syria | 85.3 /100 | #141 | Excellent $106,118 |
| Slovenes | 84.7 /100 | #142 | Excellent $106,020 |
| Tongans | 84.3 /100 | #143 | Excellent $105,967 |
Demographics Similar to Immigrants from Asia by Median Family Income
In terms of median family income, the demographic groups most similar to Immigrants from Asia are Immigrants from Turkey ($118,325, a difference of 0.030%), Australian ($118,440, a difference of 0.13%), Immigrants from Lithuania ($118,053, a difference of 0.20%), Israeli ($118,577, a difference of 0.24%), and Estonian ($118,013, a difference of 0.24%).
| Demographics | Rating | Rank | Median Family Income |
| Asians | 100.0 /100 | #32 | Exceptional $119,955 |
| Bhutanese | 100.0 /100 | #33 | Exceptional $119,800 |
| Bolivians | 100.0 /100 | #34 | Exceptional $119,479 |
| Soviet Union | 100.0 /100 | #35 | Exceptional $119,262 |
| Israelis | 100.0 /100 | #36 | Exceptional $118,577 |
| Australians | 100.0 /100 | #37 | Exceptional $118,440 |
| Immigrants | Turkey | 100.0 /100 | #38 | Exceptional $118,325 |
| Immigrants | Asia | 100.0 /100 | #39 | Exceptional $118,291 |
| Immigrants | Lithuania | 100.0 /100 | #40 | Exceptional $118,053 |
| Estonians | 100.0 /100 | #41 | Exceptional $118,013 |
| Immigrants | Bolivia | 100.0 /100 | #42 | Exceptional $117,912 |
| Bulgarians | 100.0 /100 | #43 | Exceptional $117,818 |
| Cambodians | 100.0 /100 | #44 | Exceptional $117,780 |
| Immigrants | Greece | 99.9 /100 | #45 | Exceptional $117,344 |
| Immigrants | Russia | 99.9 /100 | #46 | Exceptional $116,942 |