Arapaho vs Spanish American Indian Per Capita Income
COMPARE
Arapaho
Spanish American Indian
Per Capita Income
Per Capita Income Comparison
Arapaho
Spanish American Indians
$32,345
PER CAPITA INCOME
0.0/ 100
METRIC RATING
338th/ 347
METRIC RANK
$34,195
PER CAPITA INCOME
0.0/ 100
METRIC RATING
330th/ 347
METRIC RANK
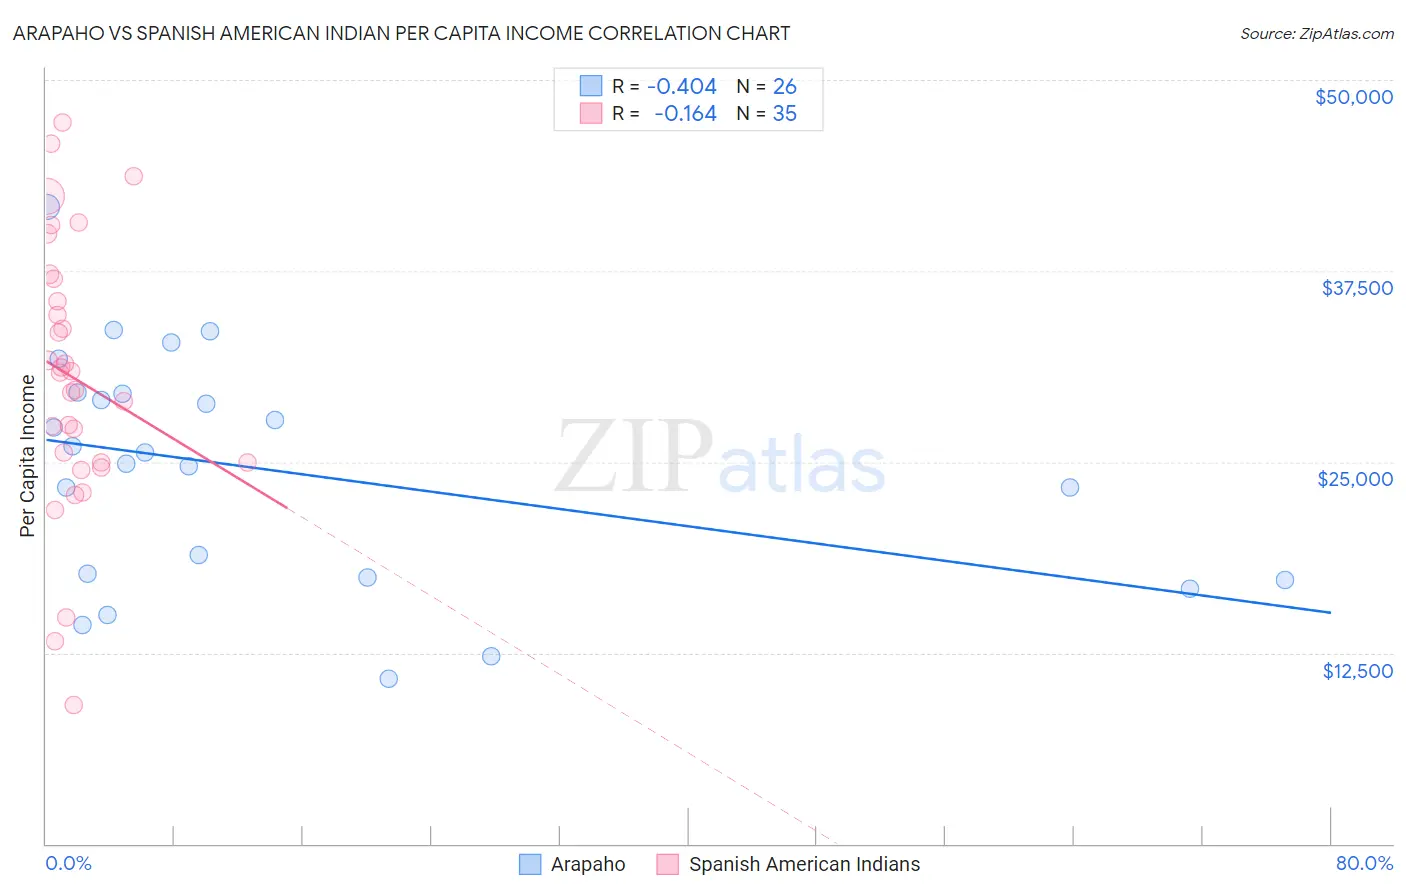
Arapaho vs Spanish American Indian Per Capita Income Correlation Chart
The statistical analysis conducted on geographies consisting of 29,780,267 people shows a moderate negative correlation between the proportion of Arapaho and per capita income in the United States with a correlation coefficient (R) of -0.404 and weighted average of $32,345. Similarly, the statistical analysis conducted on geographies consisting of 73,150,359 people shows a poor negative correlation between the proportion of Spanish American Indians and per capita income in the United States with a correlation coefficient (R) of -0.164 and weighted average of $34,195, a difference of 5.7%.
Per Capita Income Correlation Summary
| Measurement | Arapaho | Spanish American Indian |
| Minimum | $10,798 | $9,061 |
| Maximum | $41,687 | $47,199 |
| Range | $30,889 | $38,138 |
| Mean | $24,378 | $30,495 |
| Median | $25,279 | $30,854 |
| Interquartile 25% (IQ1) | $17,440 | $24,953 |
| Interquartile 75% (IQ3) | $29,495 | $37,015 |
| Interquartile Range (IQR) | $12,055 | $12,062 |
| Standard Deviation (Sample) | $7,667 | $8,840 |
| Standard Deviation (Population) | $7,518 | $8,713 |
Demographics Similar to Arapaho and Spanish American Indians by Per Capita Income
In terms of per capita income, the demographic groups most similar to Arapaho are Pueblo ($32,012, a difference of 1.0%), Crow ($31,729, a difference of 1.9%), Houma ($32,996, a difference of 2.0%), Yakama ($33,009, a difference of 2.1%), and Yuman ($33,236, a difference of 2.8%). Similarly, the demographic groups most similar to Spanish American Indians are Immigrants from Mexico ($33,931, a difference of 0.78%), Sioux ($33,921, a difference of 0.81%), Mexican ($34,559, a difference of 1.1%), Menominee ($34,578, a difference of 1.1%), and Immigrants from Yemen ($33,696, a difference of 1.5%).
| Demographics | Rating | Rank | Per Capita Income |
| Kiowa | 0.0 /100 | #324 | Tragic $35,102 |
| Immigrants | Central America | 0.0 /100 | #325 | Tragic $34,974 |
| Immigrants | Cuba | 0.0 /100 | #326 | Tragic $34,910 |
| Apache | 0.0 /100 | #327 | Tragic $34,886 |
| Menominee | 0.0 /100 | #328 | Tragic $34,578 |
| Mexicans | 0.0 /100 | #329 | Tragic $34,559 |
| Spanish American Indians | 0.0 /100 | #330 | Tragic $34,195 |
| Immigrants | Mexico | 0.0 /100 | #331 | Tragic $33,931 |
| Sioux | 0.0 /100 | #332 | Tragic $33,921 |
| Immigrants | Yemen | 0.0 /100 | #333 | Tragic $33,696 |
| Natives/Alaskans | 0.0 /100 | #334 | Tragic $33,279 |
| Yuman | 0.0 /100 | #335 | Tragic $33,236 |
| Yakama | 0.0 /100 | #336 | Tragic $33,009 |
| Houma | 0.0 /100 | #337 | Tragic $32,996 |
| Arapaho | 0.0 /100 | #338 | Tragic $32,345 |
| Pueblo | 0.0 /100 | #339 | Tragic $32,012 |
| Crow | 0.0 /100 | #340 | Tragic $31,729 |
| Puerto Ricans | 0.0 /100 | #341 | Tragic $31,268 |
| Hopi | 0.0 /100 | #342 | Tragic $31,177 |
| Pima | 0.0 /100 | #343 | Tragic $30,644 |
| Yup'ik | 0.0 /100 | #344 | Tragic $30,518 |