Arapaho vs Bangladeshi Per Capita Income
COMPARE
Arapaho
Bangladeshi
Per Capita Income
Per Capita Income Comparison
Arapaho
Bangladeshis
$32,345
PER CAPITA INCOME
0.0/ 100
METRIC RATING
338th/ 347
METRIC RANK
$35,897
PER CAPITA INCOME
0.0/ 100
METRIC RATING
318th/ 347
METRIC RANK
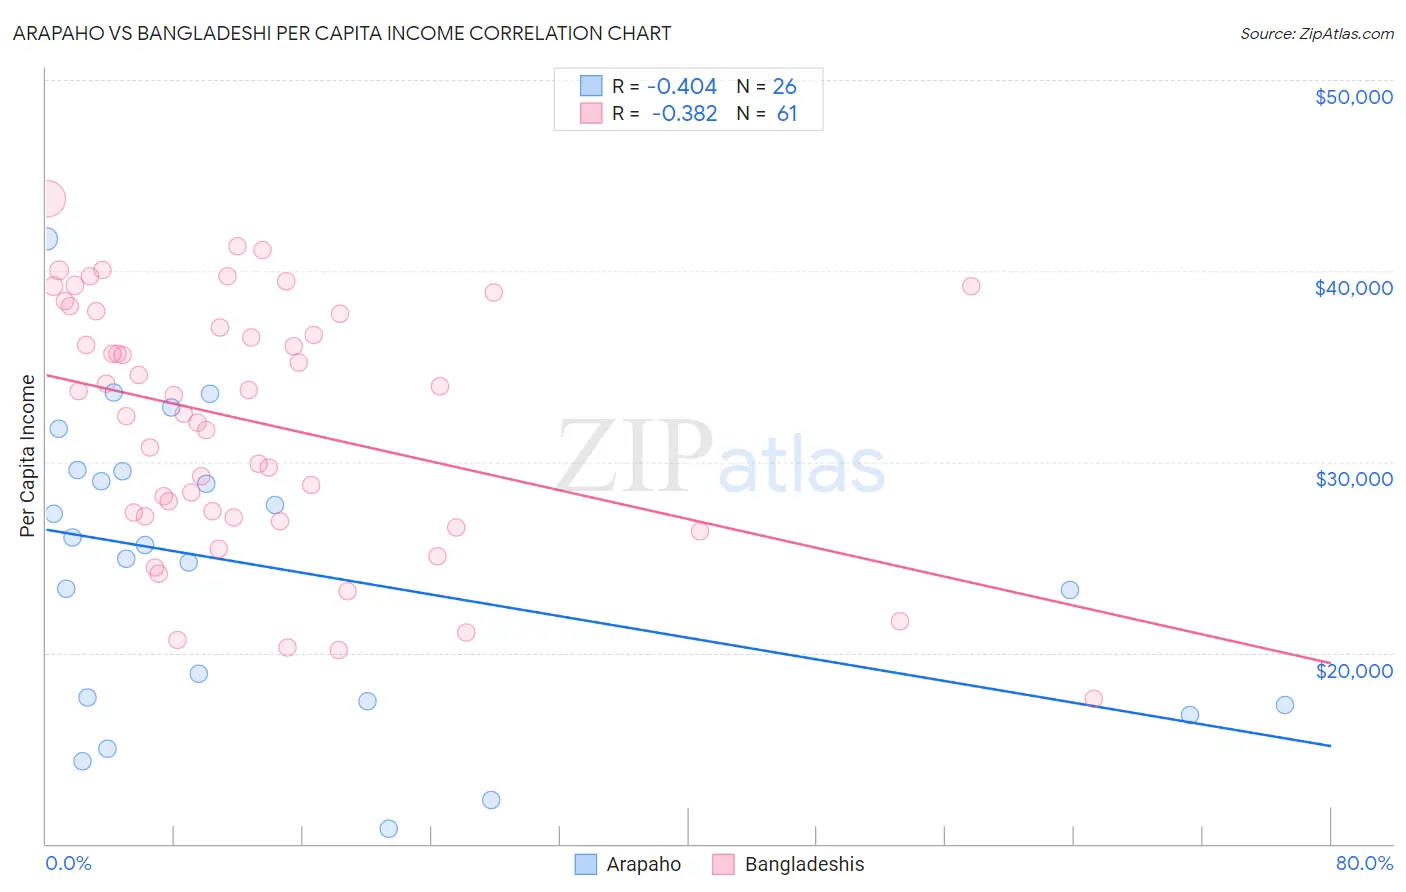
Arapaho vs Bangladeshi Per Capita Income Correlation Chart
The statistical analysis conducted on geographies consisting of 29,780,267 people shows a moderate negative correlation between the proportion of Arapaho and per capita income in the United States with a correlation coefficient (R) of -0.404 and weighted average of $32,345. Similarly, the statistical analysis conducted on geographies consisting of 141,454,199 people shows a mild negative correlation between the proportion of Bangladeshis and per capita income in the United States with a correlation coefficient (R) of -0.382 and weighted average of $35,897, a difference of 11.0%.
Per Capita Income Correlation Summary
| Measurement | Arapaho | Bangladeshi |
| Minimum | $10,798 | $17,577 |
| Maximum | $41,687 | $43,772 |
| Range | $30,889 | $26,195 |
| Mean | $24,378 | $32,070 |
| Median | $25,279 | $33,478 |
| Interquartile 25% (IQ1) | $17,440 | $27,131 |
| Interquartile 75% (IQ3) | $29,495 | $37,833 |
| Interquartile Range (IQR) | $12,055 | $10,702 |
| Standard Deviation (Sample) | $7,667 | $6,476 |
| Standard Deviation (Population) | $7,518 | $6,423 |
Demographics Similar to Arapaho and Bangladeshis by Per Capita Income
In terms of per capita income, the demographic groups most similar to Arapaho are Houma ($32,996, a difference of 2.0%), Yakama ($33,009, a difference of 2.1%), Yuman ($33,236, a difference of 2.8%), Native/Alaskan ($33,279, a difference of 2.9%), and Immigrants from Yemen ($33,696, a difference of 4.2%). Similarly, the demographic groups most similar to Bangladeshis are Immigrants from Congo ($35,720, a difference of 0.50%), Hispanic or Latino ($35,688, a difference of 0.59%), Black/African American ($35,564, a difference of 0.94%), Creek ($35,546, a difference of 0.99%), and Cheyenne ($35,276, a difference of 1.8%).
| Demographics | Rating | Rank | Per Capita Income |
| Bangladeshis | 0.0 /100 | #318 | Tragic $35,897 |
| Immigrants | Congo | 0.0 /100 | #319 | Tragic $35,720 |
| Hispanics or Latinos | 0.0 /100 | #320 | Tragic $35,688 |
| Blacks/African Americans | 0.0 /100 | #321 | Tragic $35,564 |
| Creek | 0.0 /100 | #322 | Tragic $35,546 |
| Cheyenne | 0.0 /100 | #323 | Tragic $35,276 |
| Kiowa | 0.0 /100 | #324 | Tragic $35,102 |
| Immigrants | Central America | 0.0 /100 | #325 | Tragic $34,974 |
| Immigrants | Cuba | 0.0 /100 | #326 | Tragic $34,910 |
| Apache | 0.0 /100 | #327 | Tragic $34,886 |
| Menominee | 0.0 /100 | #328 | Tragic $34,578 |
| Mexicans | 0.0 /100 | #329 | Tragic $34,559 |
| Spanish American Indians | 0.0 /100 | #330 | Tragic $34,195 |
| Immigrants | Mexico | 0.0 /100 | #331 | Tragic $33,931 |
| Sioux | 0.0 /100 | #332 | Tragic $33,921 |
| Immigrants | Yemen | 0.0 /100 | #333 | Tragic $33,696 |
| Natives/Alaskans | 0.0 /100 | #334 | Tragic $33,279 |
| Yuman | 0.0 /100 | #335 | Tragic $33,236 |
| Yakama | 0.0 /100 | #336 | Tragic $33,009 |
| Houma | 0.0 /100 | #337 | Tragic $32,996 |
| Arapaho | 0.0 /100 | #338 | Tragic $32,345 |