Arapaho vs Belgian Per Capita Income
COMPARE
Arapaho
Belgian
Per Capita Income
Per Capita Income Comparison
Arapaho
Belgians
$32,345
PER CAPITA INCOME
0.0/ 100
METRIC RATING
338th/ 347
METRIC RANK
$43,951
PER CAPITA INCOME
58.1/ 100
METRIC RATING
168th/ 347
METRIC RANK
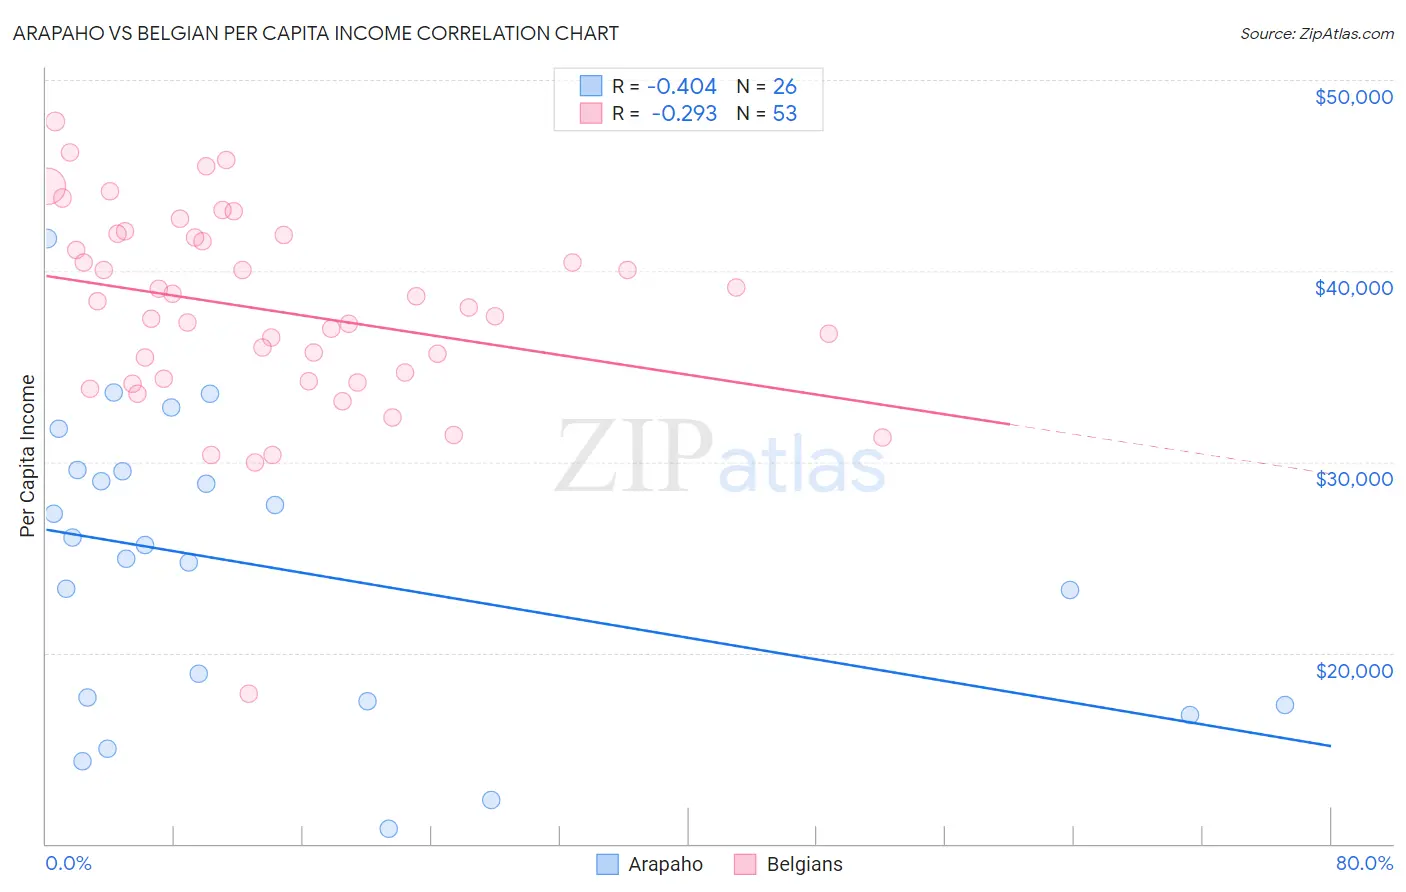
Arapaho vs Belgian Per Capita Income Correlation Chart
The statistical analysis conducted on geographies consisting of 29,780,267 people shows a moderate negative correlation between the proportion of Arapaho and per capita income in the United States with a correlation coefficient (R) of -0.404 and weighted average of $32,345. Similarly, the statistical analysis conducted on geographies consisting of 356,040,185 people shows a weak negative correlation between the proportion of Belgians and per capita income in the United States with a correlation coefficient (R) of -0.293 and weighted average of $43,951, a difference of 35.9%.
Per Capita Income Correlation Summary
| Measurement | Arapaho | Belgian |
| Minimum | $10,798 | $17,858 |
| Maximum | $41,687 | $47,841 |
| Range | $30,889 | $29,983 |
| Mean | $24,378 | $37,900 |
| Median | $25,279 | $38,096 |
| Interquartile 25% (IQ1) | $17,440 | $34,290 |
| Interquartile 75% (IQ3) | $29,495 | $41,814 |
| Interquartile Range (IQR) | $12,055 | $7,525 |
| Standard Deviation (Sample) | $7,667 | $5,270 |
| Standard Deviation (Population) | $7,518 | $5,220 |
Similar Demographics by Per Capita Income
Demographics Similar to Arapaho by Per Capita Income
In terms of per capita income, the demographic groups most similar to Arapaho are Pueblo ($32,012, a difference of 1.0%), Crow ($31,729, a difference of 1.9%), Houma ($32,996, a difference of 2.0%), Yakama ($33,009, a difference of 2.1%), and Yuman ($33,236, a difference of 2.8%).
| Demographics | Rating | Rank | Per Capita Income |
| Immigrants | Mexico | 0.0 /100 | #331 | Tragic $33,931 |
| Sioux | 0.0 /100 | #332 | Tragic $33,921 |
| Immigrants | Yemen | 0.0 /100 | #333 | Tragic $33,696 |
| Natives/Alaskans | 0.0 /100 | #334 | Tragic $33,279 |
| Yuman | 0.0 /100 | #335 | Tragic $33,236 |
| Yakama | 0.0 /100 | #336 | Tragic $33,009 |
| Houma | 0.0 /100 | #337 | Tragic $32,996 |
| Arapaho | 0.0 /100 | #338 | Tragic $32,345 |
| Pueblo | 0.0 /100 | #339 | Tragic $32,012 |
| Crow | 0.0 /100 | #340 | Tragic $31,729 |
| Puerto Ricans | 0.0 /100 | #341 | Tragic $31,268 |
| Hopi | 0.0 /100 | #342 | Tragic $31,177 |
| Pima | 0.0 /100 | #343 | Tragic $30,644 |
| Yup'ik | 0.0 /100 | #344 | Tragic $30,518 |
| Tohono O'odham | 0.0 /100 | #345 | Tragic $30,256 |
Demographics Similar to Belgians by Per Capita Income
In terms of per capita income, the demographic groups most similar to Belgians are English ($43,982, a difference of 0.070%), Immigrants from Uruguay ($43,997, a difference of 0.10%), Immigrants from Philippines ($44,000, a difference of 0.11%), Sri Lankan ($44,014, a difference of 0.14%), and Immigrants from Peru ($43,852, a difference of 0.23%).
| Demographics | Rating | Rank | Per Capita Income |
| Costa Ricans | 61.8 /100 | #161 | Good $44,090 |
| Swiss | 61.4 /100 | #162 | Good $44,076 |
| Immigrants | South America | 61.2 /100 | #163 | Good $44,068 |
| Sri Lankans | 59.8 /100 | #164 | Average $44,014 |
| Immigrants | Philippines | 59.4 /100 | #165 | Average $44,000 |
| Immigrants | Uruguay | 59.3 /100 | #166 | Average $43,997 |
| English | 58.9 /100 | #167 | Average $43,982 |
| Belgians | 58.1 /100 | #168 | Average $43,951 |
| Immigrants | Peru | 55.3 /100 | #169 | Average $43,852 |
| Scandinavians | 55.2 /100 | #170 | Average $43,848 |
| Immigrants | Eastern Africa | 54.9 /100 | #171 | Average $43,838 |
| Czechoslovakians | 54.1 /100 | #172 | Average $43,806 |
| French | 50.7 /100 | #173 | Average $43,685 |
| Colombians | 50.0 /100 | #174 | Average $43,661 |
| Celtics | 48.9 /100 | #175 | Average $43,621 |