Alsatian vs Subsaharan African Median Earnings
COMPARE
Alsatian
Subsaharan African
Median Earnings
Median Earnings Comparison
Alsatians
Sub-Saharan Africans
$47,023
MEDIAN EARNINGS
69.6/ 100
METRIC RATING
160th/ 347
METRIC RANK
$44,118
MEDIAN EARNINGS
3.7/ 100
METRIC RATING
243rd/ 347
METRIC RANK
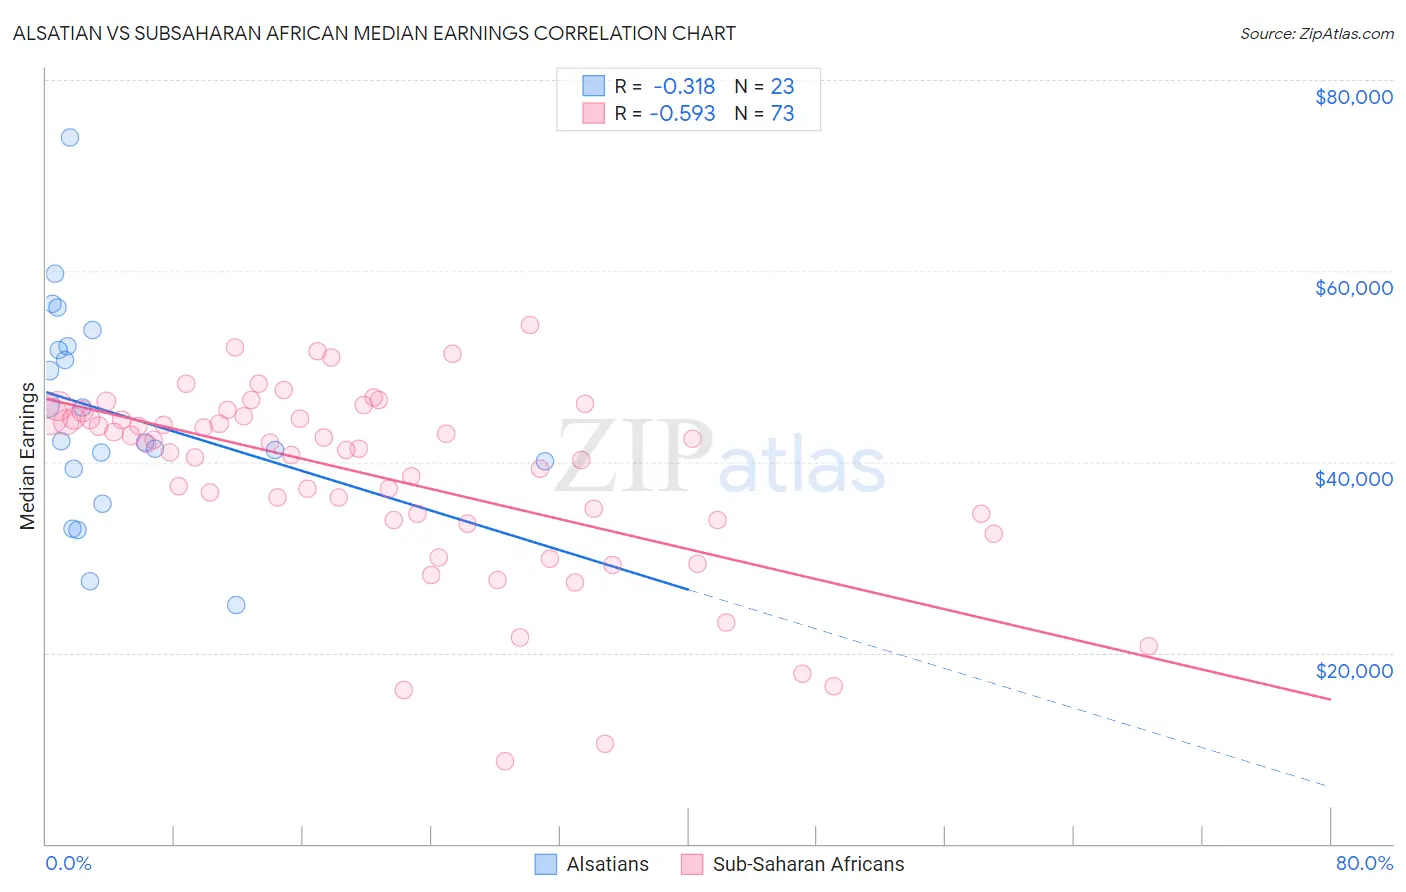
Alsatian vs Subsaharan African Median Earnings Correlation Chart
The statistical analysis conducted on geographies consisting of 82,677,221 people shows a mild negative correlation between the proportion of Alsatians and median earnings in the United States with a correlation coefficient (R) of -0.318 and weighted average of $47,023. Similarly, the statistical analysis conducted on geographies consisting of 508,173,504 people shows a substantial negative correlation between the proportion of Sub-Saharan Africans and median earnings in the United States with a correlation coefficient (R) of -0.593 and weighted average of $44,118, a difference of 6.6%.
Median Earnings Correlation Summary
| Measurement | Alsatian | Subsaharan African |
| Minimum | $25,064 | $8,672 |
| Maximum | $73,935 | $54,367 |
| Range | $48,871 | $45,695 |
| Mean | $45,093 | $38,469 |
| Median | $42,188 | $41,866 |
| Interquartile 25% (IQ1) | $39,345 | $33,941 |
| Interquartile 75% (IQ3) | $52,137 | $44,774 |
| Interquartile Range (IQR) | $12,792 | $10,833 |
| Standard Deviation (Sample) | $11,160 | $9,878 |
| Standard Deviation (Population) | $10,915 | $9,810 |
Similar Demographics by Median Earnings
Demographics Similar to Alsatians by Median Earnings
In terms of median earnings, the demographic groups most similar to Alsatians are Immigrants from Peru ($47,025, a difference of 0.0%), Immigrants from Eastern Africa ($46,969, a difference of 0.11%), Slovak ($47,095, a difference of 0.15%), South American Indian ($46,952, a difference of 0.15%), and Icelander ($46,916, a difference of 0.23%).
| Demographics | Rating | Rank | Median Earnings |
| Slavs | 81.1 /100 | #153 | Excellent $47,470 |
| Immigrants | Portugal | 77.3 /100 | #154 | Good $47,304 |
| Immigrants | Vietnam | 76.7 /100 | #155 | Good $47,282 |
| Irish | 76.6 /100 | #156 | Good $47,276 |
| Czechs | 75.1 /100 | #157 | Good $47,221 |
| Slovaks | 71.7 /100 | #158 | Good $47,095 |
| Immigrants | Peru | 69.6 /100 | #159 | Good $47,025 |
| Alsatians | 69.6 /100 | #160 | Good $47,023 |
| Immigrants | Eastern Africa | 68.0 /100 | #161 | Good $46,969 |
| South American Indians | 67.4 /100 | #162 | Good $46,952 |
| Icelanders | 66.3 /100 | #163 | Good $46,916 |
| Norwegians | 64.7 /100 | #164 | Good $46,865 |
| South Americans | 62.7 /100 | #165 | Good $46,804 |
| Czechoslovakians | 57.8 /100 | #166 | Average $46,658 |
| Costa Ricans | 57.4 /100 | #167 | Average $46,645 |
Demographics Similar to Sub-Saharan Africans by Median Earnings
In terms of median earnings, the demographic groups most similar to Sub-Saharan Africans are Nonimmigrants ($44,117, a difference of 0.0%), Immigrants from Venezuela ($44,163, a difference of 0.10%), Samoan ($44,206, a difference of 0.20%), Immigrants from Burma/Myanmar ($43,998, a difference of 0.27%), and Aleut ($44,241, a difference of 0.28%).
| Demographics | Rating | Rank | Median Earnings |
| British West Indians | 6.7 /100 | #236 | Tragic $44,552 |
| Immigrants | Ecuador | 5.9 /100 | #237 | Tragic $44,462 |
| Sudanese | 5.6 /100 | #238 | Tragic $44,419 |
| Senegalese | 5.3 /100 | #239 | Tragic $44,373 |
| Aleuts | 4.4 /100 | #240 | Tragic $44,241 |
| Samoans | 4.2 /100 | #241 | Tragic $44,206 |
| Immigrants | Venezuela | 4.0 /100 | #242 | Tragic $44,163 |
| Sub-Saharan Africans | 3.7 /100 | #243 | Tragic $44,118 |
| Immigrants | Nonimmigrants | 3.7 /100 | #244 | Tragic $44,117 |
| Immigrants | Burma/Myanmar | 3.2 /100 | #245 | Tragic $43,998 |
| Immigrants | West Indies | 3.1 /100 | #246 | Tragic $43,989 |
| Immigrants | Cabo Verde | 3.0 /100 | #247 | Tragic $43,963 |
| Nepalese | 2.6 /100 | #248 | Tragic $43,860 |
| Malaysians | 2.6 /100 | #249 | Tragic $43,844 |
| Alaska Natives | 2.3 /100 | #250 | Tragic $43,750 |