Alsatian vs Subsaharan African Master's Degree
COMPARE
Alsatian
Subsaharan African
Master's Degree
Master's Degree Comparison
Alsatians
Sub-Saharan Africans
16.9%
MASTER'S DEGREE
98.4/ 100
METRIC RATING
103rd/ 347
METRIC RANK
14.2%
MASTER'S DEGREE
19.4/ 100
METRIC RATING
210th/ 347
METRIC RANK
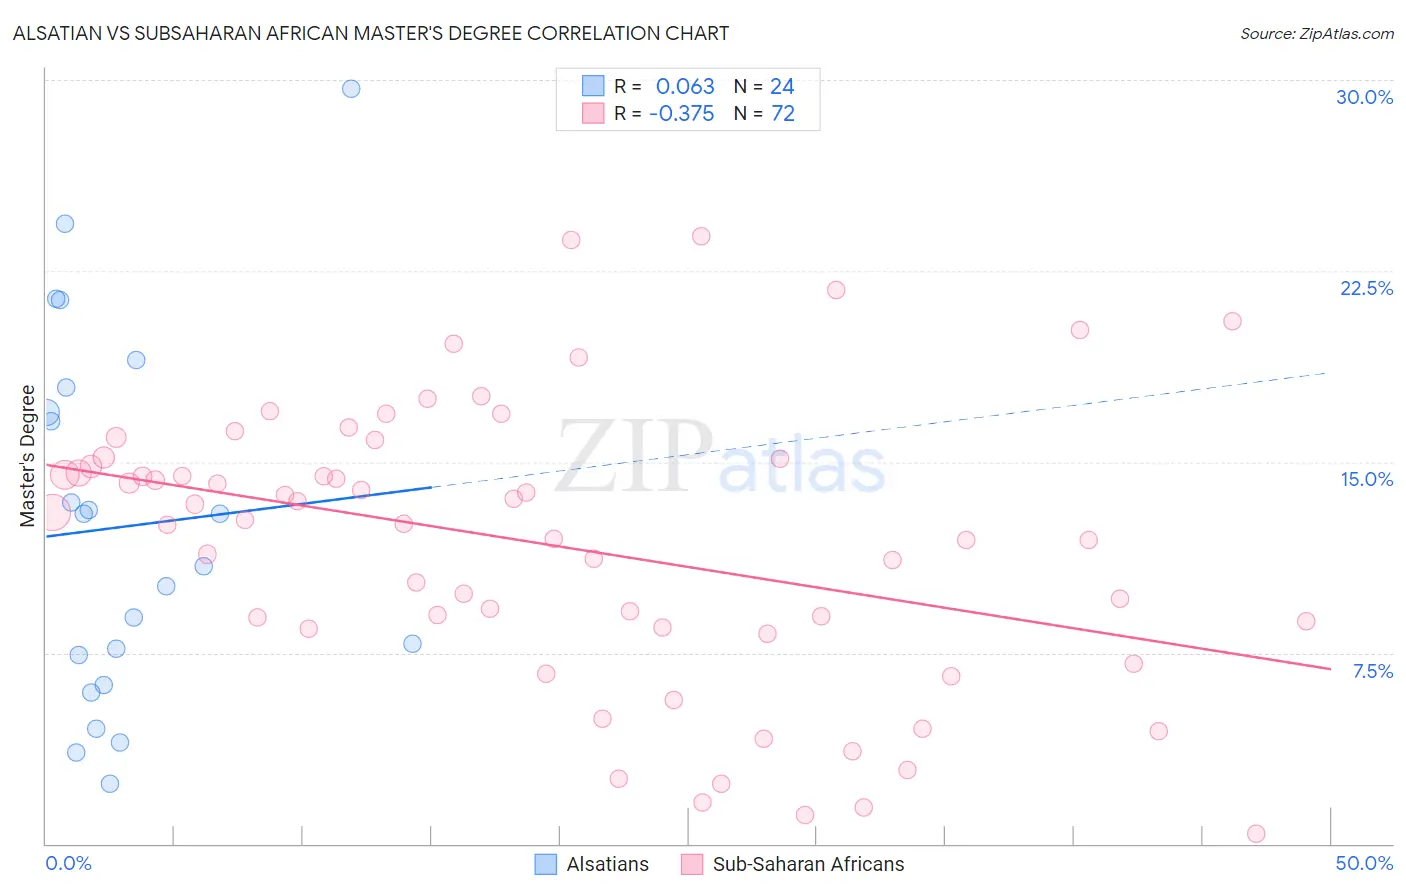
Alsatian vs Subsaharan African Master's Degree Correlation Chart
The statistical analysis conducted on geographies consisting of 82,679,386 people shows a slight positive correlation between the proportion of Alsatians and percentage of population with at least master's degree education in the United States with a correlation coefficient (R) of 0.063 and weighted average of 16.9%. Similarly, the statistical analysis conducted on geographies consisting of 507,799,388 people shows a mild negative correlation between the proportion of Sub-Saharan Africans and percentage of population with at least master's degree education in the United States with a correlation coefficient (R) of -0.375 and weighted average of 14.2%, a difference of 18.6%.
Master's Degree Correlation Summary
| Measurement | Alsatian | Subsaharan African |
| Minimum | 2.4% | 0.40% |
| Maximum | 29.7% | 23.9% |
| Range | 27.3% | 23.5% |
| Mean | 12.5% | 11.7% |
| Median | 11.9% | 12.6% |
| Interquartile 25% (IQ1) | 6.8% | 8.5% |
| Interquartile 75% (IQ3) | 17.4% | 15.0% |
| Interquartile Range (IQR) | 10.6% | 6.5% |
| Standard Deviation (Sample) | 7.2% | 5.5% |
| Standard Deviation (Population) | 7.1% | 5.5% |
Similar Demographics by Master's Degree
Demographics Similar to Alsatians by Master's Degree
In terms of master's degree, the demographic groups most similar to Alsatians are Ukrainian (16.9%, a difference of 0.12%), Syrian (16.8%, a difference of 0.22%), Chilean (16.9%, a difference of 0.33%), Immigrants from Nepal (17.0%, a difference of 0.41%), and Immigrants from Albania (16.8%, a difference of 0.50%).
| Demographics | Rating | Rank | Master's Degree |
| Immigrants | Northern Africa | 98.9 /100 | #96 | Exceptional 17.1% |
| Immigrants | England | 98.8 /100 | #97 | Exceptional 17.0% |
| Immigrants | Ukraine | 98.8 /100 | #98 | Exceptional 17.0% |
| Laotians | 98.8 /100 | #99 | Exceptional 17.0% |
| Albanians | 98.7 /100 | #100 | Exceptional 17.0% |
| Immigrants | Nepal | 98.6 /100 | #101 | Exceptional 17.0% |
| Chileans | 98.6 /100 | #102 | Exceptional 16.9% |
| Alsatians | 98.4 /100 | #103 | Exceptional 16.9% |
| Ukrainians | 98.3 /100 | #104 | Exceptional 16.9% |
| Syrians | 98.3 /100 | #105 | Exceptional 16.8% |
| Immigrants | Albania | 98.1 /100 | #106 | Exceptional 16.8% |
| Armenians | 98.0 /100 | #107 | Exceptional 16.8% |
| Sierra Leoneans | 98.0 /100 | #108 | Exceptional 16.8% |
| Moroccans | 98.0 /100 | #109 | Exceptional 16.8% |
| Immigrants | Chile | 98.0 /100 | #110 | Exceptional 16.8% |
Demographics Similar to Sub-Saharan Africans by Master's Degree
In terms of master's degree, the demographic groups most similar to Sub-Saharan Africans are Immigrants from Panama (14.3%, a difference of 0.13%), Immigrants from Barbados (14.3%, a difference of 0.22%), Somali (14.2%, a difference of 0.31%), Spanish (14.2%, a difference of 0.36%), and Immigrants from Bosnia and Herzegovina (14.3%, a difference of 0.52%).
| Demographics | Rating | Rank | Master's Degree |
| Yugoslavians | 24.3 /100 | #203 | Fair 14.4% |
| French | 23.7 /100 | #204 | Fair 14.4% |
| Trinidadians and Tobagonians | 23.5 /100 | #205 | Fair 14.4% |
| Scandinavians | 23.3 /100 | #206 | Fair 14.4% |
| Immigrants | Bosnia and Herzegovina | 22.0 /100 | #207 | Fair 14.3% |
| Immigrants | Barbados | 20.5 /100 | #208 | Fair 14.3% |
| Immigrants | Panama | 20.0 /100 | #209 | Fair 14.3% |
| Sub-Saharan Africans | 19.4 /100 | #210 | Poor 14.2% |
| Somalis | 18.0 /100 | #211 | Poor 14.2% |
| Spanish | 17.8 /100 | #212 | Poor 14.2% |
| Immigrants | Thailand | 17.0 /100 | #213 | Poor 14.2% |
| Finns | 16.9 /100 | #214 | Poor 14.2% |
| Immigrants | Vietnam | 16.1 /100 | #215 | Poor 14.1% |
| Immigrants | Somalia | 15.8 /100 | #216 | Poor 14.1% |
| Immigrants | Trinidad and Tobago | 15.8 /100 | #217 | Poor 14.1% |