Alsatian vs Immigrants from Latvia Median Earnings
COMPARE
Alsatian
Immigrants from Latvia
Median Earnings
Median Earnings Comparison
Alsatians
Immigrants from Latvia
$47,023
MEDIAN EARNINGS
69.6/ 100
METRIC RATING
160th/ 347
METRIC RANK
$51,555
MEDIAN EARNINGS
99.9/ 100
METRIC RATING
61st/ 347
METRIC RANK
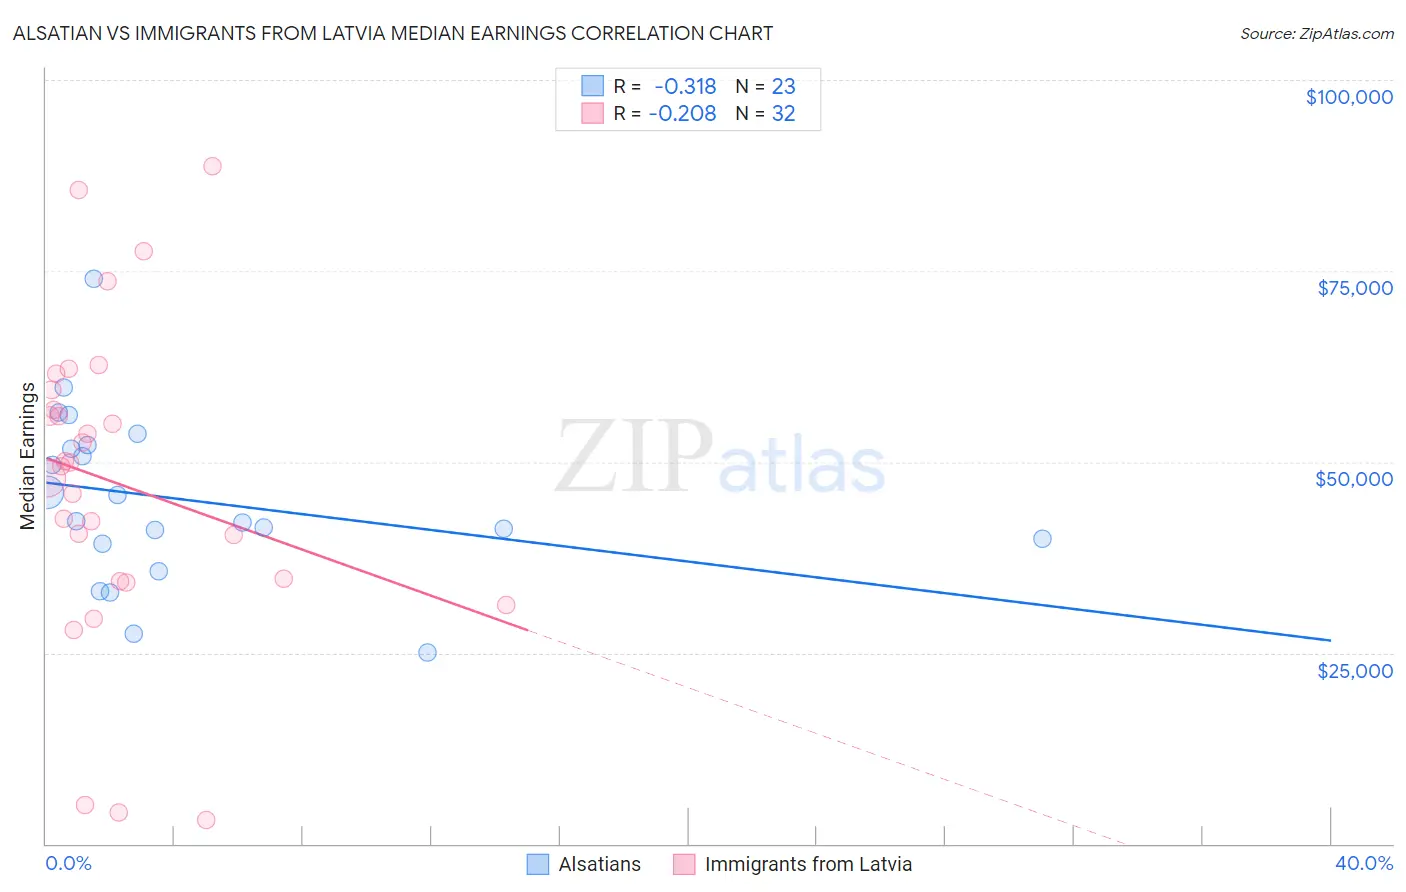
Alsatian vs Immigrants from Latvia Median Earnings Correlation Chart
The statistical analysis conducted on geographies consisting of 82,677,221 people shows a mild negative correlation between the proportion of Alsatians and median earnings in the United States with a correlation coefficient (R) of -0.318 and weighted average of $47,023. Similarly, the statistical analysis conducted on geographies consisting of 113,739,608 people shows a weak negative correlation between the proportion of Immigrants from Latvia and median earnings in the United States with a correlation coefficient (R) of -0.208 and weighted average of $51,555, a difference of 9.6%.
Median Earnings Correlation Summary
| Measurement | Alsatian | Immigrants from Latvia |
| Minimum | $25,064 | $3,188 |
| Maximum | $73,935 | $88,678 |
| Range | $48,871 | $85,490 |
| Mean | $45,093 | $47,322 |
| Median | $42,188 | $49,671 |
| Interquartile 25% (IQ1) | $39,345 | $34,454 |
| Interquartile 75% (IQ3) | $52,137 | $58,094 |
| Interquartile Range (IQR) | $12,792 | $23,640 |
| Standard Deviation (Sample) | $11,160 | $20,618 |
| Standard Deviation (Population) | $10,915 | $20,294 |
Similar Demographics by Median Earnings
Demographics Similar to Alsatians by Median Earnings
In terms of median earnings, the demographic groups most similar to Alsatians are Immigrants from Peru ($47,025, a difference of 0.0%), Immigrants from Eastern Africa ($46,969, a difference of 0.11%), Slovak ($47,095, a difference of 0.15%), South American Indian ($46,952, a difference of 0.15%), and Icelander ($46,916, a difference of 0.23%).
| Demographics | Rating | Rank | Median Earnings |
| Slavs | 81.1 /100 | #153 | Excellent $47,470 |
| Immigrants | Portugal | 77.3 /100 | #154 | Good $47,304 |
| Immigrants | Vietnam | 76.7 /100 | #155 | Good $47,282 |
| Irish | 76.6 /100 | #156 | Good $47,276 |
| Czechs | 75.1 /100 | #157 | Good $47,221 |
| Slovaks | 71.7 /100 | #158 | Good $47,095 |
| Immigrants | Peru | 69.6 /100 | #159 | Good $47,025 |
| Alsatians | 69.6 /100 | #160 | Good $47,023 |
| Immigrants | Eastern Africa | 68.0 /100 | #161 | Good $46,969 |
| South American Indians | 67.4 /100 | #162 | Good $46,952 |
| Icelanders | 66.3 /100 | #163 | Good $46,916 |
| Norwegians | 64.7 /100 | #164 | Good $46,865 |
| South Americans | 62.7 /100 | #165 | Good $46,804 |
| Czechoslovakians | 57.8 /100 | #166 | Average $46,658 |
| Costa Ricans | 57.4 /100 | #167 | Average $46,645 |
Demographics Similar to Immigrants from Latvia by Median Earnings
In terms of median earnings, the demographic groups most similar to Immigrants from Latvia are Immigrants from Serbia ($51,557, a difference of 0.0%), Immigrants from Croatia ($51,581, a difference of 0.050%), Immigrants from Bolivia ($51,605, a difference of 0.10%), Immigrants from Eastern Europe ($51,624, a difference of 0.13%), and Immigrants from Pakistan ($51,693, a difference of 0.27%).
| Demographics | Rating | Rank | Median Earnings |
| Immigrants | Indonesia | 99.9 /100 | #54 | Exceptional $51,715 |
| Egyptians | 99.9 /100 | #55 | Exceptional $51,701 |
| Immigrants | Pakistan | 99.9 /100 | #56 | Exceptional $51,693 |
| Immigrants | Eastern Europe | 99.9 /100 | #57 | Exceptional $51,624 |
| Immigrants | Bolivia | 99.9 /100 | #58 | Exceptional $51,605 |
| Immigrants | Croatia | 99.9 /100 | #59 | Exceptional $51,581 |
| Immigrants | Serbia | 99.9 /100 | #60 | Exceptional $51,557 |
| Immigrants | Latvia | 99.9 /100 | #61 | Exceptional $51,555 |
| Immigrants | Romania | 99.9 /100 | #62 | Exceptional $51,337 |
| Immigrants | Bulgaria | 99.9 /100 | #63 | Exceptional $51,318 |
| New Zealanders | 99.9 /100 | #64 | Exceptional $51,246 |
| Greeks | 99.9 /100 | #65 | Exceptional $51,164 |
| Afghans | 99.9 /100 | #66 | Exceptional $51,112 |
| Immigrants | Spain | 99.9 /100 | #67 | Exceptional $51,092 |
| Paraguayans | 99.9 /100 | #68 | Exceptional $51,068 |