Egyptian vs Subsaharan African Median Earnings
COMPARE
Egyptian
Subsaharan African
Median Earnings
Median Earnings Comparison
Egyptians
Sub-Saharan Africans
$51,701
MEDIAN EARNINGS
99.9/ 100
METRIC RATING
55th/ 347
METRIC RANK
$44,118
MEDIAN EARNINGS
3.7/ 100
METRIC RATING
243rd/ 347
METRIC RANK
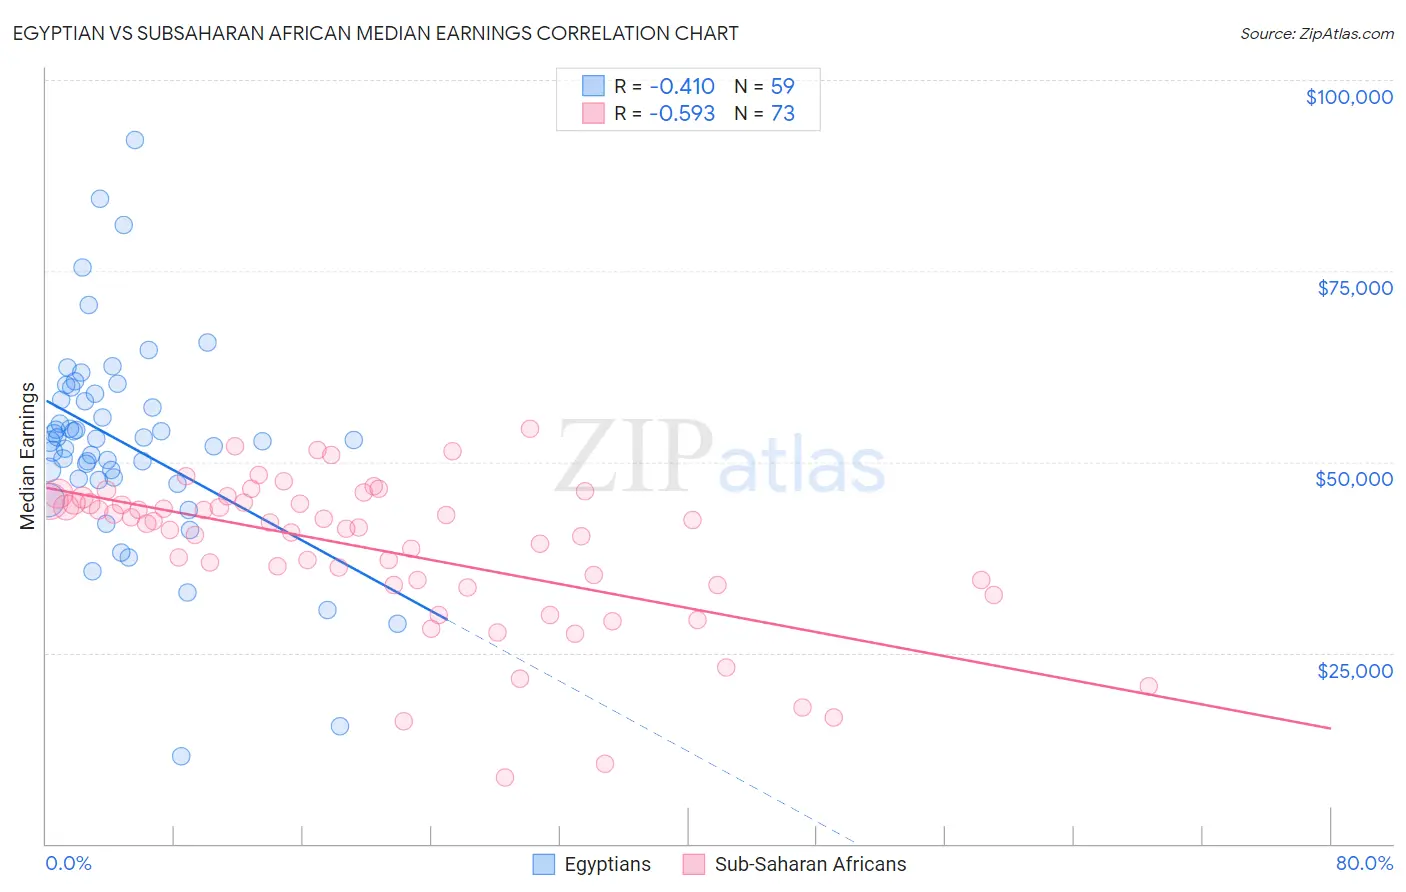
Egyptian vs Subsaharan African Median Earnings Correlation Chart
The statistical analysis conducted on geographies consisting of 276,931,355 people shows a moderate negative correlation between the proportion of Egyptians and median earnings in the United States with a correlation coefficient (R) of -0.410 and weighted average of $51,701. Similarly, the statistical analysis conducted on geographies consisting of 508,173,504 people shows a substantial negative correlation between the proportion of Sub-Saharan Africans and median earnings in the United States with a correlation coefficient (R) of -0.593 and weighted average of $44,118, a difference of 17.2%.
Median Earnings Correlation Summary
| Measurement | Egyptian | Subsaharan African |
| Minimum | $11,442 | $8,672 |
| Maximum | $92,200 | $54,367 |
| Range | $80,758 | $45,695 |
| Mean | $52,434 | $38,469 |
| Median | $52,906 | $41,866 |
| Interquartile 25% (IQ1) | $47,712 | $33,941 |
| Interquartile 75% (IQ3) | $58,933 | $44,774 |
| Interquartile Range (IQR) | $11,221 | $10,833 |
| Standard Deviation (Sample) | $13,766 | $9,878 |
| Standard Deviation (Population) | $13,649 | $9,810 |
Similar Demographics by Median Earnings
Demographics Similar to Egyptians by Median Earnings
In terms of median earnings, the demographic groups most similar to Egyptians are Immigrants from Pakistan ($51,693, a difference of 0.010%), Immigrants from Indonesia ($51,715, a difference of 0.030%), Immigrants from Norway ($51,758, a difference of 0.11%), Estonian ($51,772, a difference of 0.14%), and Immigrants from Eastern Europe ($51,624, a difference of 0.15%).
| Demographics | Rating | Rank | Median Earnings |
| Immigrants | Europe | 100.0 /100 | #48 | Exceptional $52,195 |
| Bolivians | 100.0 /100 | #49 | Exceptional $52,005 |
| Immigrants | South Africa | 100.0 /100 | #50 | Exceptional $51,850 |
| Immigrants | Austria | 99.9 /100 | #51 | Exceptional $51,826 |
| Estonians | 99.9 /100 | #52 | Exceptional $51,772 |
| Immigrants | Norway | 99.9 /100 | #53 | Exceptional $51,758 |
| Immigrants | Indonesia | 99.9 /100 | #54 | Exceptional $51,715 |
| Egyptians | 99.9 /100 | #55 | Exceptional $51,701 |
| Immigrants | Pakistan | 99.9 /100 | #56 | Exceptional $51,693 |
| Immigrants | Eastern Europe | 99.9 /100 | #57 | Exceptional $51,624 |
| Immigrants | Bolivia | 99.9 /100 | #58 | Exceptional $51,605 |
| Immigrants | Croatia | 99.9 /100 | #59 | Exceptional $51,581 |
| Immigrants | Serbia | 99.9 /100 | #60 | Exceptional $51,557 |
| Immigrants | Latvia | 99.9 /100 | #61 | Exceptional $51,555 |
| Immigrants | Romania | 99.9 /100 | #62 | Exceptional $51,337 |
Demographics Similar to Sub-Saharan Africans by Median Earnings
In terms of median earnings, the demographic groups most similar to Sub-Saharan Africans are Nonimmigrants ($44,117, a difference of 0.0%), Immigrants from Venezuela ($44,163, a difference of 0.10%), Samoan ($44,206, a difference of 0.20%), Immigrants from Burma/Myanmar ($43,998, a difference of 0.27%), and Aleut ($44,241, a difference of 0.28%).
| Demographics | Rating | Rank | Median Earnings |
| British West Indians | 6.7 /100 | #236 | Tragic $44,552 |
| Immigrants | Ecuador | 5.9 /100 | #237 | Tragic $44,462 |
| Sudanese | 5.6 /100 | #238 | Tragic $44,419 |
| Senegalese | 5.3 /100 | #239 | Tragic $44,373 |
| Aleuts | 4.4 /100 | #240 | Tragic $44,241 |
| Samoans | 4.2 /100 | #241 | Tragic $44,206 |
| Immigrants | Venezuela | 4.0 /100 | #242 | Tragic $44,163 |
| Sub-Saharan Africans | 3.7 /100 | #243 | Tragic $44,118 |
| Immigrants | Nonimmigrants | 3.7 /100 | #244 | Tragic $44,117 |
| Immigrants | Burma/Myanmar | 3.2 /100 | #245 | Tragic $43,998 |
| Immigrants | West Indies | 3.1 /100 | #246 | Tragic $43,989 |
| Immigrants | Cabo Verde | 3.0 /100 | #247 | Tragic $43,963 |
| Nepalese | 2.6 /100 | #248 | Tragic $43,860 |
| Malaysians | 2.6 /100 | #249 | Tragic $43,844 |
| Alaska Natives | 2.3 /100 | #250 | Tragic $43,750 |