Alsatian vs Subsaharan African Associate's Degree
COMPARE
Alsatian
Subsaharan African
Associate's Degree
Associate's Degree Comparison
Alsatians
Sub-Saharan Africans
48.8%
ASSOCIATE'S DEGREE
94.6/ 100
METRIC RATING
120th/ 347
METRIC RANK
43.9%
ASSOCIATE'S DEGREE
5.5/ 100
METRIC RATING
223rd/ 347
METRIC RANK
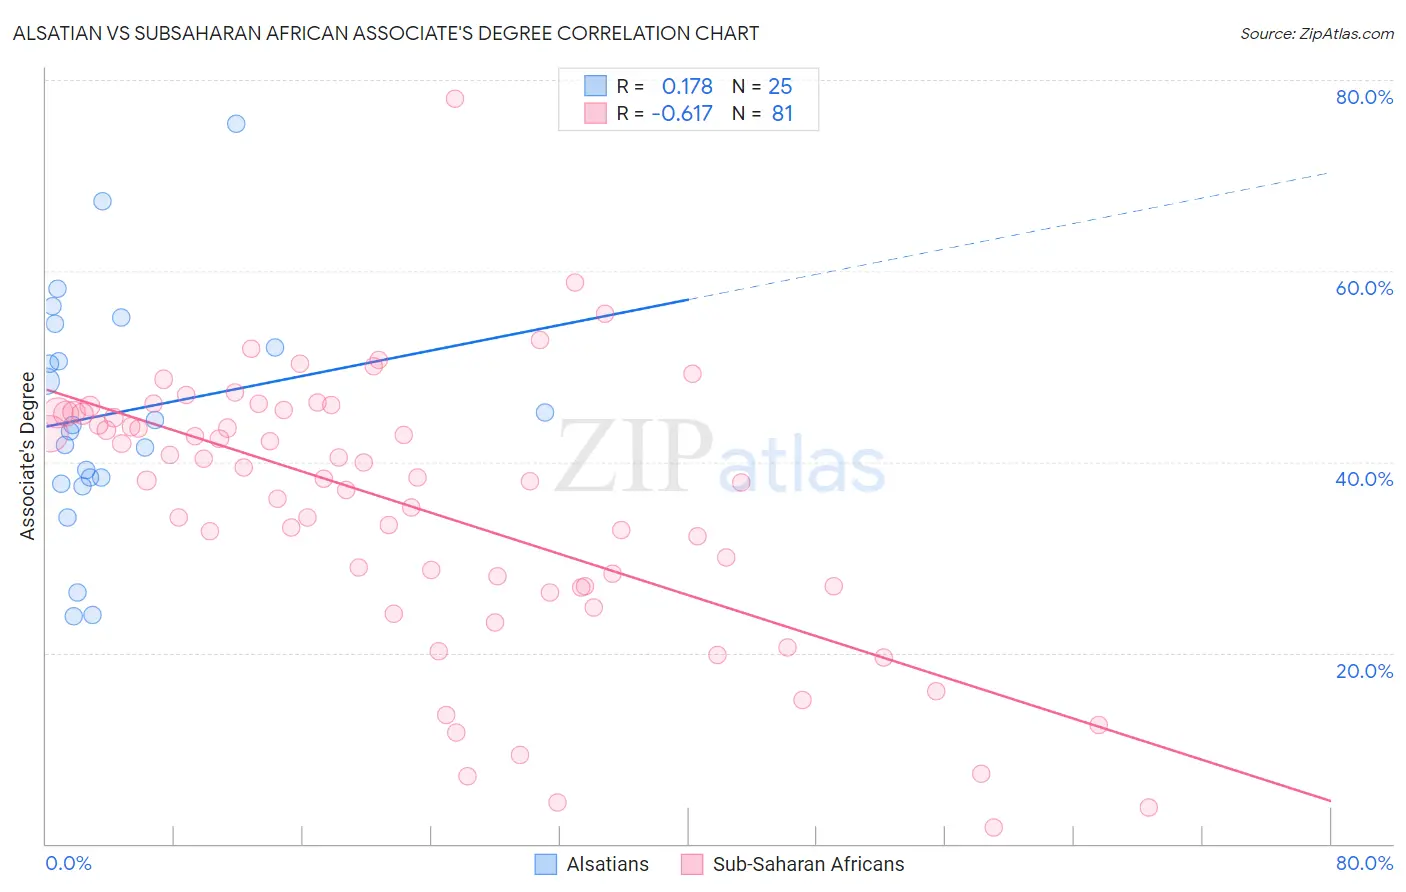
Alsatian vs Subsaharan African Associate's Degree Correlation Chart
The statistical analysis conducted on geographies consisting of 82,682,365 people shows a poor positive correlation between the proportion of Alsatians and percentage of population with at least associate's degree education in the United States with a correlation coefficient (R) of 0.178 and weighted average of 48.8%. Similarly, the statistical analysis conducted on geographies consisting of 508,152,134 people shows a significant negative correlation between the proportion of Sub-Saharan Africans and percentage of population with at least associate's degree education in the United States with a correlation coefficient (R) of -0.617 and weighted average of 43.9%, a difference of 11.2%.
Associate's Degree Correlation Summary
| Measurement | Alsatian | Subsaharan African |
| Minimum | 23.9% | 1.7% |
| Maximum | 75.4% | 78.0% |
| Range | 51.6% | 76.2% |
| Mean | 45.1% | 35.2% |
| Median | 43.9% | 38.3% |
| Interquartile 25% (IQ1) | 38.0% | 26.9% |
| Interquartile 75% (IQ3) | 53.2% | 45.1% |
| Interquartile Range (IQR) | 15.2% | 18.2% |
| Standard Deviation (Sample) | 12.3% | 14.2% |
| Standard Deviation (Population) | 12.1% | 14.1% |
Similar Demographics by Associate's Degree
Demographics Similar to Alsatians by Associate's Degree
In terms of associate's degree, the demographic groups most similar to Alsatians are Lebanese (48.8%, a difference of 0.020%), Albanian (48.8%, a difference of 0.030%), Afghan (48.9%, a difference of 0.10%), British (48.9%, a difference of 0.14%), and Luxembourger (48.9%, a difference of 0.20%).
| Demographics | Rating | Rank | Associate's Degree |
| Palestinians | 95.3 /100 | #113 | Exceptional 49.0% |
| Arabs | 95.3 /100 | #114 | Exceptional 49.0% |
| Luxembourgers | 95.1 /100 | #115 | Exceptional 48.9% |
| British | 95.0 /100 | #116 | Exceptional 48.9% |
| Afghans | 94.8 /100 | #117 | Exceptional 48.9% |
| Albanians | 94.7 /100 | #118 | Exceptional 48.8% |
| Lebanese | 94.6 /100 | #119 | Exceptional 48.8% |
| Alsatians | 94.6 /100 | #120 | Exceptional 48.8% |
| Ugandans | 93.9 /100 | #121 | Exceptional 48.7% |
| Italians | 93.9 /100 | #122 | Exceptional 48.7% |
| Brazilians | 93.7 /100 | #123 | Exceptional 48.7% |
| Serbians | 92.6 /100 | #124 | Exceptional 48.5% |
| Chinese | 92.5 /100 | #125 | Exceptional 48.5% |
| Immigrants | Syria | 92.2 /100 | #126 | Exceptional 48.5% |
| Immigrants | Uganda | 92.1 /100 | #127 | Exceptional 48.5% |
Demographics Similar to Sub-Saharan Africans by Associate's Degree
In terms of associate's degree, the demographic groups most similar to Sub-Saharan Africans are Barbadian (43.9%, a difference of 0.10%), West Indian (43.8%, a difference of 0.14%), Guamanian/Chamorro (43.8%, a difference of 0.29%), Immigrants from Western Africa (44.1%, a difference of 0.37%), and Immigrants from Burma/Myanmar (43.7%, a difference of 0.51%).
| Demographics | Rating | Rank | Associate's Degree |
| Immigrants | Nigeria | 11.4 /100 | #216 | Poor 44.6% |
| Immigrants | Immigrants | 10.5 /100 | #217 | Poor 44.5% |
| Spanish | 9.4 /100 | #218 | Tragic 44.4% |
| Whites/Caucasians | 7.5 /100 | #219 | Tragic 44.2% |
| Portuguese | 7.2 /100 | #220 | Tragic 44.1% |
| Immigrants | Western Africa | 6.6 /100 | #221 | Tragic 44.1% |
| Barbadians | 5.8 /100 | #222 | Tragic 43.9% |
| Sub-Saharan Africans | 5.5 /100 | #223 | Tragic 43.9% |
| West Indians | 5.2 /100 | #224 | Tragic 43.8% |
| Guamanians/Chamorros | 4.8 /100 | #225 | Tragic 43.8% |
| Immigrants | Burma/Myanmar | 4.3 /100 | #226 | Tragic 43.7% |
| Trinidadians and Tobagonians | 4.0 /100 | #227 | Tragic 43.6% |
| Hmong | 3.2 /100 | #228 | Tragic 43.4% |
| Immigrants | Trinidad and Tobago | 3.0 /100 | #229 | Tragic 43.3% |
| Immigrants | Barbados | 2.9 /100 | #230 | Tragic 43.3% |