Alsatian vs Northern European Median Earnings
COMPARE
Alsatian
Northern European
Median Earnings
Median Earnings Comparison
Alsatians
Northern Europeans
$47,023
MEDIAN EARNINGS
69.6/ 100
METRIC RATING
160th/ 347
METRIC RANK
$48,887
MEDIAN EARNINGS
96.9/ 100
METRIC RATING
112th/ 347
METRIC RANK
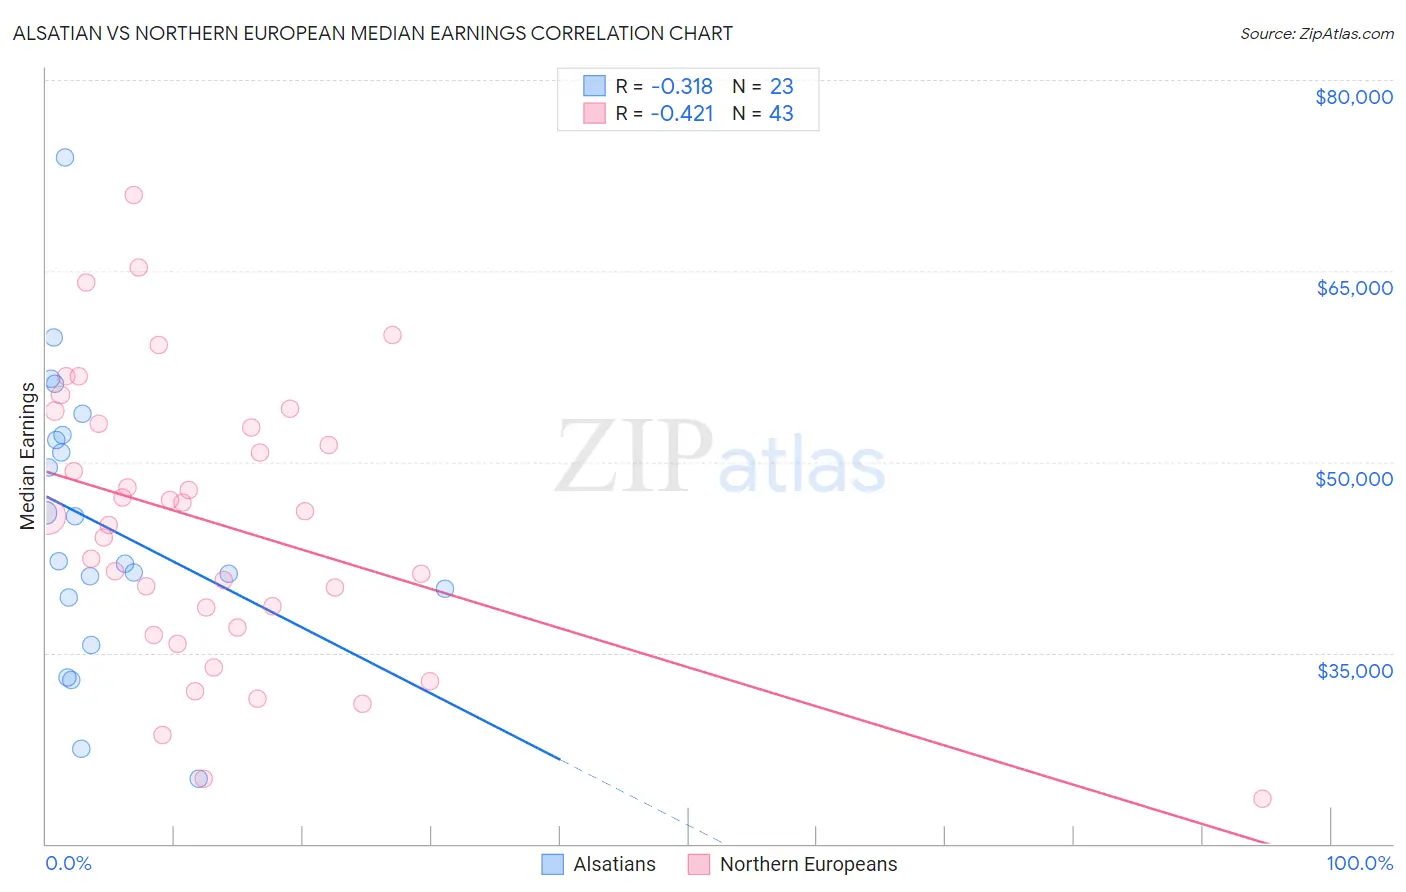
Alsatian vs Northern European Median Earnings Correlation Chart
The statistical analysis conducted on geographies consisting of 82,677,221 people shows a mild negative correlation between the proportion of Alsatians and median earnings in the United States with a correlation coefficient (R) of -0.318 and weighted average of $47,023. Similarly, the statistical analysis conducted on geographies consisting of 406,030,818 people shows a moderate negative correlation between the proportion of Northern Europeans and median earnings in the United States with a correlation coefficient (R) of -0.421 and weighted average of $48,887, a difference of 4.0%.
Median Earnings Correlation Summary
| Measurement | Alsatian | Northern European |
| Minimum | $25,064 | $23,571 |
| Maximum | $73,935 | $70,939 |
| Range | $48,871 | $47,368 |
| Mean | $45,093 | $45,160 |
| Median | $42,188 | $45,714 |
| Interquartile 25% (IQ1) | $39,345 | $37,035 |
| Interquartile 75% (IQ3) | $52,137 | $52,998 |
| Interquartile Range (IQR) | $12,792 | $15,963 |
| Standard Deviation (Sample) | $11,160 | $10,934 |
| Standard Deviation (Population) | $10,915 | $10,806 |
Similar Demographics by Median Earnings
Demographics Similar to Alsatians by Median Earnings
In terms of median earnings, the demographic groups most similar to Alsatians are Immigrants from Peru ($47,025, a difference of 0.0%), Immigrants from Eastern Africa ($46,969, a difference of 0.11%), Slovak ($47,095, a difference of 0.15%), South American Indian ($46,952, a difference of 0.15%), and Icelander ($46,916, a difference of 0.23%).
| Demographics | Rating | Rank | Median Earnings |
| Slavs | 81.1 /100 | #153 | Excellent $47,470 |
| Immigrants | Portugal | 77.3 /100 | #154 | Good $47,304 |
| Immigrants | Vietnam | 76.7 /100 | #155 | Good $47,282 |
| Irish | 76.6 /100 | #156 | Good $47,276 |
| Czechs | 75.1 /100 | #157 | Good $47,221 |
| Slovaks | 71.7 /100 | #158 | Good $47,095 |
| Immigrants | Peru | 69.6 /100 | #159 | Good $47,025 |
| Alsatians | 69.6 /100 | #160 | Good $47,023 |
| Immigrants | Eastern Africa | 68.0 /100 | #161 | Good $46,969 |
| South American Indians | 67.4 /100 | #162 | Good $46,952 |
| Icelanders | 66.3 /100 | #163 | Good $46,916 |
| Norwegians | 64.7 /100 | #164 | Good $46,865 |
| South Americans | 62.7 /100 | #165 | Good $46,804 |
| Czechoslovakians | 57.8 /100 | #166 | Average $46,658 |
| Costa Ricans | 57.4 /100 | #167 | Average $46,645 |
Demographics Similar to Northern Europeans by Median Earnings
In terms of median earnings, the demographic groups most similar to Northern Europeans are Immigrants from Zimbabwe ($48,913, a difference of 0.050%), Immigrants from Kuwait ($48,861, a difference of 0.050%), Immigrants from Ethiopia ($48,924, a difference of 0.070%), Syrian ($48,934, a difference of 0.10%), and Moroccan ($48,838, a difference of 0.10%).
| Demographics | Rating | Rank | Median Earnings |
| Immigrants | Western Asia | 98.4 /100 | #105 | Exceptional $49,389 |
| Immigrants | Albania | 98.4 /100 | #106 | Exceptional $49,377 |
| Immigrants | Morocco | 98.4 /100 | #107 | Exceptional $49,368 |
| Palestinians | 98.0 /100 | #108 | Exceptional $49,209 |
| Syrians | 97.1 /100 | #109 | Exceptional $48,934 |
| Immigrants | Ethiopia | 97.1 /100 | #110 | Exceptional $48,924 |
| Immigrants | Zimbabwe | 97.0 /100 | #111 | Exceptional $48,913 |
| Northern Europeans | 96.9 /100 | #112 | Exceptional $48,887 |
| Immigrants | Kuwait | 96.8 /100 | #113 | Exceptional $48,861 |
| Moroccans | 96.7 /100 | #114 | Exceptional $48,838 |
| Chinese | 96.7 /100 | #115 | Exceptional $48,836 |
| Koreans | 96.2 /100 | #116 | Exceptional $48,727 |
| Serbians | 95.9 /100 | #117 | Exceptional $48,677 |
| Immigrants | Jordan | 95.9 /100 | #118 | Exceptional $48,673 |
| Poles | 95.8 /100 | #119 | Exceptional $48,659 |