Alsatian vs Haitian Householder Income Ages 45 - 64 years
COMPARE
Alsatian
Haitian
Householder Income Ages 45 - 64 years
Householder Income Ages 45 - 64 years Comparison
Alsatians
Haitians
$100,435
HOUSEHOLDER INCOME AGES 45 - 64 YEARS
51.4/ 100
METRIC RATING
173rd/ 347
METRIC RANK
$84,384
HOUSEHOLDER INCOME AGES 45 - 64 YEARS
0.0/ 100
METRIC RATING
302nd/ 347
METRIC RANK
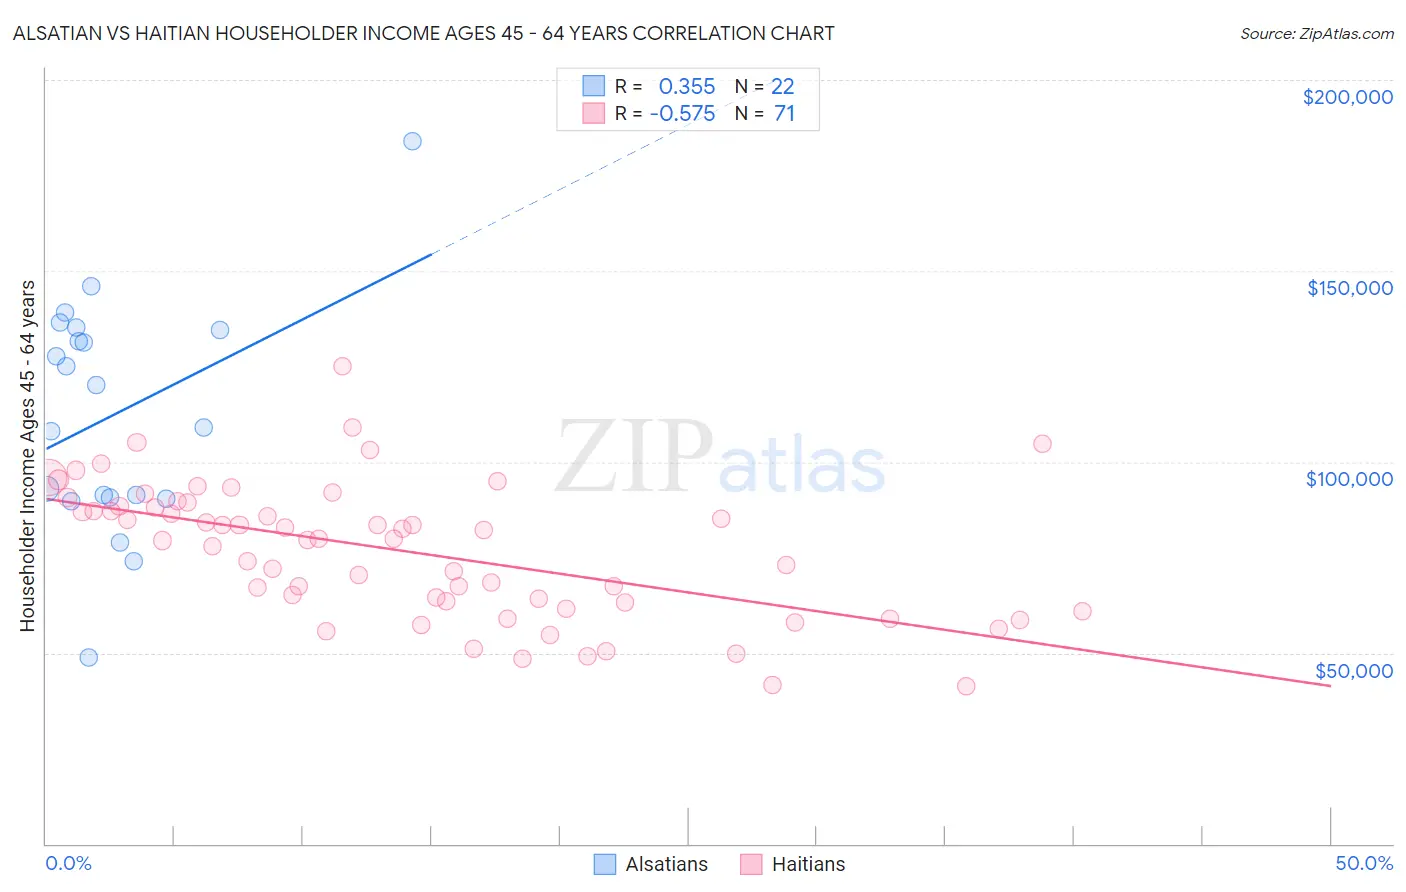
Alsatian vs Haitian Householder Income Ages 45 - 64 years Correlation Chart
The statistical analysis conducted on geographies consisting of 82,661,679 people shows a mild positive correlation between the proportion of Alsatians and household income with householder between the ages 45 and 64 in the United States with a correlation coefficient (R) of 0.355 and weighted average of $100,435. Similarly, the statistical analysis conducted on geographies consisting of 287,353,050 people shows a substantial negative correlation between the proportion of Haitians and household income with householder between the ages 45 and 64 in the United States with a correlation coefficient (R) of -0.575 and weighted average of $84,384, a difference of 19.0%.
Householder Income Ages 45 - 64 years Correlation Summary
| Measurement | Alsatian | Haitian |
| Minimum | $48,731 | $41,306 |
| Maximum | $184,018 | $125,012 |
| Range | $135,287 | $83,706 |
| Mean | $112,529 | $76,677 |
| Median | $114,674 | $79,782 |
| Interquartile 25% (IQ1) | $90,588 | $63,219 |
| Interquartile 75% (IQ3) | $134,688 | $88,532 |
| Interquartile Range (IQR) | $44,100 | $25,313 |
| Standard Deviation (Sample) | $30,232 | $17,503 |
| Standard Deviation (Population) | $29,537 | $17,379 |
Similar Demographics by Householder Income Ages 45 - 64 years
Demographics Similar to Alsatians by Householder Income Ages 45 - 64 years
In terms of householder income ages 45 - 64 years, the demographic groups most similar to Alsatians are Immigrants from Uzbekistan ($100,523, a difference of 0.090%), Welsh ($100,322, a difference of 0.11%), German ($100,224, a difference of 0.21%), Immigrants from Costa Rica ($100,141, a difference of 0.29%), and Moroccan ($100,138, a difference of 0.30%).
| Demographics | Rating | Rank | Householder Income Ages 45 - 64 years |
| Samoans | 65.3 /100 | #166 | Good $101,580 |
| Czechoslovakians | 63.0 /100 | #167 | Good $101,387 |
| South American Indians | 60.5 /100 | #168 | Good $101,171 |
| Guamanians/Chamorros | 60.5 /100 | #169 | Good $101,170 |
| Slovaks | 58.8 /100 | #170 | Average $101,029 |
| South Americans | 56.4 /100 | #171 | Average $100,837 |
| Immigrants | Uzbekistan | 52.5 /100 | #172 | Average $100,523 |
| Alsatians | 51.4 /100 | #173 | Average $100,435 |
| Welsh | 50.0 /100 | #174 | Average $100,322 |
| Germans | 48.8 /100 | #175 | Average $100,224 |
| Immigrants | Costa Rica | 47.7 /100 | #176 | Average $100,141 |
| Moroccans | 47.7 /100 | #177 | Average $100,138 |
| Immigrants | Cameroon | 47.0 /100 | #178 | Average $100,084 |
| Belgians | 46.7 /100 | #179 | Average $100,060 |
| Aleuts | 46.6 /100 | #180 | Average $100,052 |
Demographics Similar to Haitians by Householder Income Ages 45 - 64 years
In terms of householder income ages 45 - 64 years, the demographic groups most similar to Haitians are Potawatomi ($84,613, a difference of 0.27%), Honduran ($84,079, a difference of 0.36%), Ottawa ($83,953, a difference of 0.51%), Chippewa ($83,943, a difference of 0.52%), and Ute ($83,937, a difference of 0.53%).
| Demographics | Rating | Rank | Householder Income Ages 45 - 64 years |
| Immigrants | Grenada | 0.1 /100 | #295 | Tragic $85,552 |
| Immigrants | Zaire | 0.1 /100 | #296 | Tragic $85,207 |
| Fijians | 0.1 /100 | #297 | Tragic $85,187 |
| Africans | 0.0 /100 | #298 | Tragic $84,925 |
| Immigrants | Mexico | 0.0 /100 | #299 | Tragic $84,910 |
| Indonesians | 0.0 /100 | #300 | Tragic $84,890 |
| Potawatomi | 0.0 /100 | #301 | Tragic $84,613 |
| Haitians | 0.0 /100 | #302 | Tragic $84,384 |
| Hondurans | 0.0 /100 | #303 | Tragic $84,079 |
| Ottawa | 0.0 /100 | #304 | Tragic $83,953 |
| Chippewa | 0.0 /100 | #305 | Tragic $83,943 |
| Ute | 0.0 /100 | #306 | Tragic $83,937 |
| Shoshone | 0.0 /100 | #307 | Tragic $83,588 |
| Immigrants | Cabo Verde | 0.0 /100 | #308 | Tragic $83,542 |
| Immigrants | Dominica | 0.0 /100 | #309 | Tragic $83,311 |