Alsatian vs Scandinavian Householder Income Ages 45 - 64 years
COMPARE
Alsatian
Scandinavian
Householder Income Ages 45 - 64 years
Householder Income Ages 45 - 64 years Comparison
Alsatians
Scandinavians
$100,435
HOUSEHOLDER INCOME AGES 45 - 64 YEARS
51.4/ 100
METRIC RATING
173rd/ 347
METRIC RANK
$102,969
HOUSEHOLDER INCOME AGES 45 - 64 YEARS
79.0/ 100
METRIC RATING
153rd/ 347
METRIC RANK
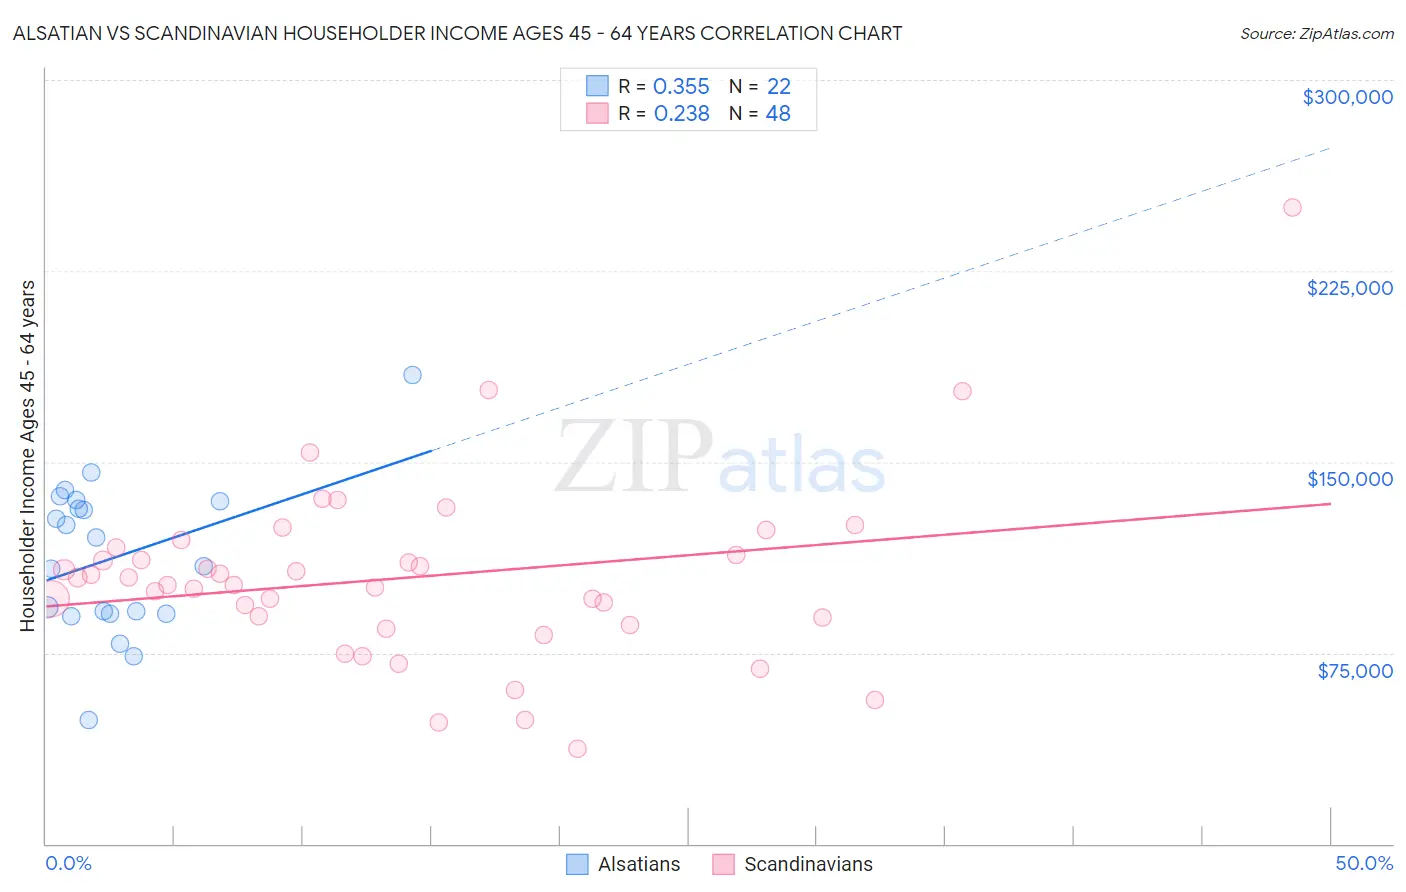
Alsatian vs Scandinavian Householder Income Ages 45 - 64 years Correlation Chart
The statistical analysis conducted on geographies consisting of 82,661,679 people shows a mild positive correlation between the proportion of Alsatians and household income with householder between the ages 45 and 64 in the United States with a correlation coefficient (R) of 0.355 and weighted average of $100,435. Similarly, the statistical analysis conducted on geographies consisting of 471,257,536 people shows a weak positive correlation between the proportion of Scandinavians and household income with householder between the ages 45 and 64 in the United States with a correlation coefficient (R) of 0.238 and weighted average of $102,969, a difference of 2.5%.
Householder Income Ages 45 - 64 years Correlation Summary
| Measurement | Alsatian | Scandinavian |
| Minimum | $48,731 | $37,396 |
| Maximum | $184,018 | $250,001 |
| Range | $135,287 | $212,605 |
| Mean | $112,529 | $104,566 |
| Median | $114,674 | $103,110 |
| Interquartile 25% (IQ1) | $90,588 | $87,340 |
| Interquartile 75% (IQ3) | $134,688 | $114,988 |
| Interquartile Range (IQR) | $44,100 | $27,648 |
| Standard Deviation (Sample) | $30,232 | $35,851 |
| Standard Deviation (Population) | $29,537 | $35,476 |
Demographics Similar to Alsatians and Scandinavians by Householder Income Ages 45 - 64 years
In terms of householder income ages 45 - 64 years, the demographic groups most similar to Alsatians are Immigrants from Uzbekistan ($100,523, a difference of 0.090%), South American ($100,837, a difference of 0.40%), Slovak ($101,029, a difference of 0.59%), South American Indian ($101,171, a difference of 0.73%), and Guamanian/Chamorro ($101,170, a difference of 0.73%). Similarly, the demographic groups most similar to Scandinavians are Slovene ($102,885, a difference of 0.080%), Costa Rican ($102,779, a difference of 0.19%), Carpatho Rusyn ($102,777, a difference of 0.19%), Immigrants from Ethiopia ($102,763, a difference of 0.20%), and Slavic ($102,629, a difference of 0.33%).
| Demographics | Rating | Rank | Householder Income Ages 45 - 64 years |
| Scandinavians | 79.0 /100 | #153 | Good $102,969 |
| Slovenes | 78.3 /100 | #154 | Good $102,885 |
| Costa Ricans | 77.4 /100 | #155 | Good $102,779 |
| Carpatho Rusyns | 77.4 /100 | #156 | Good $102,777 |
| Immigrants | Ethiopia | 77.3 /100 | #157 | Good $102,763 |
| Slavs | 76.1 /100 | #158 | Good $102,629 |
| Sierra Leoneans | 74.2 /100 | #159 | Good $102,427 |
| Icelanders | 72.5 /100 | #160 | Good $102,261 |
| Immigrants | Nepal | 71.8 /100 | #161 | Good $102,190 |
| Scottish | 71.1 /100 | #162 | Good $102,123 |
| English | 70.1 /100 | #163 | Good $102,021 |
| Immigrants | Morocco | 70.0 /100 | #164 | Good $102,015 |
| Immigrants | Albania | 69.4 /100 | #165 | Good $101,957 |
| Samoans | 65.3 /100 | #166 | Good $101,580 |
| Czechoslovakians | 63.0 /100 | #167 | Good $101,387 |
| South American Indians | 60.5 /100 | #168 | Good $101,171 |
| Guamanians/Chamorros | 60.5 /100 | #169 | Good $101,170 |
| Slovaks | 58.8 /100 | #170 | Average $101,029 |
| South Americans | 56.4 /100 | #171 | Average $100,837 |
| Immigrants | Uzbekistan | 52.5 /100 | #172 | Average $100,523 |
| Alsatians | 51.4 /100 | #173 | Average $100,435 |