Bangladeshi vs Immigrants from Latvia Median Earnings
COMPARE
Bangladeshi
Immigrants from Latvia
Median Earnings
Median Earnings Comparison
Bangladeshis
Immigrants from Latvia
$41,263
MEDIAN EARNINGS
0.1/ 100
METRIC RATING
295th/ 347
METRIC RANK
$51,555
MEDIAN EARNINGS
99.9/ 100
METRIC RATING
61st/ 347
METRIC RANK
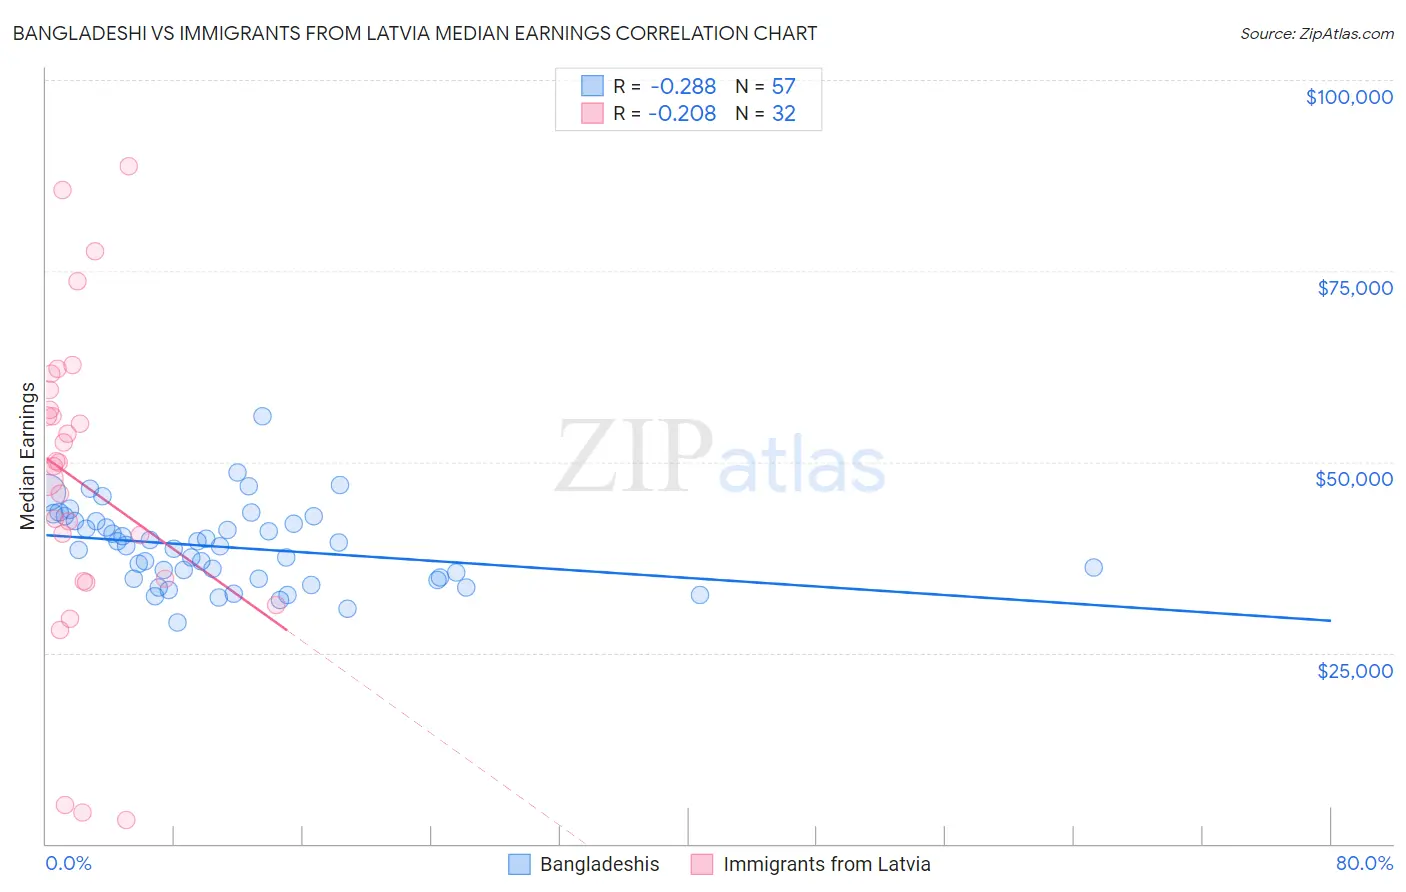
Bangladeshi vs Immigrants from Latvia Median Earnings Correlation Chart
The statistical analysis conducted on geographies consisting of 141,452,923 people shows a weak negative correlation between the proportion of Bangladeshis and median earnings in the United States with a correlation coefficient (R) of -0.288 and weighted average of $41,263. Similarly, the statistical analysis conducted on geographies consisting of 113,739,608 people shows a weak negative correlation between the proportion of Immigrants from Latvia and median earnings in the United States with a correlation coefficient (R) of -0.208 and weighted average of $51,555, a difference of 24.9%.
Median Earnings Correlation Summary
| Measurement | Bangladeshi | Immigrants from Latvia |
| Minimum | $28,992 | $3,188 |
| Maximum | $55,893 | $88,678 |
| Range | $26,901 | $85,490 |
| Mean | $38,826 | $47,322 |
| Median | $38,964 | $49,671 |
| Interquartile 25% (IQ1) | $34,688 | $34,454 |
| Interquartile 75% (IQ3) | $42,288 | $58,094 |
| Interquartile Range (IQR) | $7,600 | $23,640 |
| Standard Deviation (Sample) | $5,171 | $20,618 |
| Standard Deviation (Population) | $5,125 | $20,294 |
Similar Demographics by Median Earnings
Demographics Similar to Bangladeshis by Median Earnings
In terms of median earnings, the demographic groups most similar to Bangladeshis are Cherokee ($41,252, a difference of 0.030%), Potawatomi ($41,288, a difference of 0.060%), Guatemalan ($41,205, a difference of 0.14%), Immigrants from Zaire ($41,325, a difference of 0.15%), and Immigrants from Micronesia ($41,133, a difference of 0.32%).
| Demographics | Rating | Rank | Median Earnings |
| Immigrants | Dominican Republic | 0.1 /100 | #288 | Tragic $41,554 |
| Comanche | 0.1 /100 | #289 | Tragic $41,519 |
| Paiute | 0.1 /100 | #290 | Tragic $41,508 |
| Central American Indians | 0.1 /100 | #291 | Tragic $41,474 |
| U.S. Virgin Islanders | 0.1 /100 | #292 | Tragic $41,448 |
| Immigrants | Zaire | 0.1 /100 | #293 | Tragic $41,325 |
| Potawatomi | 0.1 /100 | #294 | Tragic $41,288 |
| Bangladeshis | 0.1 /100 | #295 | Tragic $41,263 |
| Cherokee | 0.1 /100 | #296 | Tragic $41,252 |
| Guatemalans | 0.1 /100 | #297 | Tragic $41,205 |
| Immigrants | Micronesia | 0.1 /100 | #298 | Tragic $41,133 |
| Immigrants | Caribbean | 0.1 /100 | #299 | Tragic $41,119 |
| Ute | 0.1 /100 | #300 | Tragic $41,051 |
| Immigrants | Latin America | 0.1 /100 | #301 | Tragic $41,049 |
| Shoshone | 0.0 /100 | #302 | Tragic $40,932 |
Demographics Similar to Immigrants from Latvia by Median Earnings
In terms of median earnings, the demographic groups most similar to Immigrants from Latvia are Immigrants from Serbia ($51,557, a difference of 0.0%), Immigrants from Croatia ($51,581, a difference of 0.050%), Immigrants from Bolivia ($51,605, a difference of 0.10%), Immigrants from Eastern Europe ($51,624, a difference of 0.13%), and Immigrants from Pakistan ($51,693, a difference of 0.27%).
| Demographics | Rating | Rank | Median Earnings |
| Immigrants | Indonesia | 99.9 /100 | #54 | Exceptional $51,715 |
| Egyptians | 99.9 /100 | #55 | Exceptional $51,701 |
| Immigrants | Pakistan | 99.9 /100 | #56 | Exceptional $51,693 |
| Immigrants | Eastern Europe | 99.9 /100 | #57 | Exceptional $51,624 |
| Immigrants | Bolivia | 99.9 /100 | #58 | Exceptional $51,605 |
| Immigrants | Croatia | 99.9 /100 | #59 | Exceptional $51,581 |
| Immigrants | Serbia | 99.9 /100 | #60 | Exceptional $51,557 |
| Immigrants | Latvia | 99.9 /100 | #61 | Exceptional $51,555 |
| Immigrants | Romania | 99.9 /100 | #62 | Exceptional $51,337 |
| Immigrants | Bulgaria | 99.9 /100 | #63 | Exceptional $51,318 |
| New Zealanders | 99.9 /100 | #64 | Exceptional $51,246 |
| Greeks | 99.9 /100 | #65 | Exceptional $51,164 |
| Afghans | 99.9 /100 | #66 | Exceptional $51,112 |
| Immigrants | Spain | 99.9 /100 | #67 | Exceptional $51,092 |
| Paraguayans | 99.9 /100 | #68 | Exceptional $51,068 |