Barbadian vs Immigrants from Latvia Median Earnings
COMPARE
Barbadian
Immigrants from Latvia
Median Earnings
Median Earnings Comparison
Barbadians
Immigrants from Latvia
$45,846
MEDIAN EARNINGS
30.5/ 100
METRIC RATING
197th/ 347
METRIC RANK
$51,555
MEDIAN EARNINGS
99.9/ 100
METRIC RATING
61st/ 347
METRIC RANK
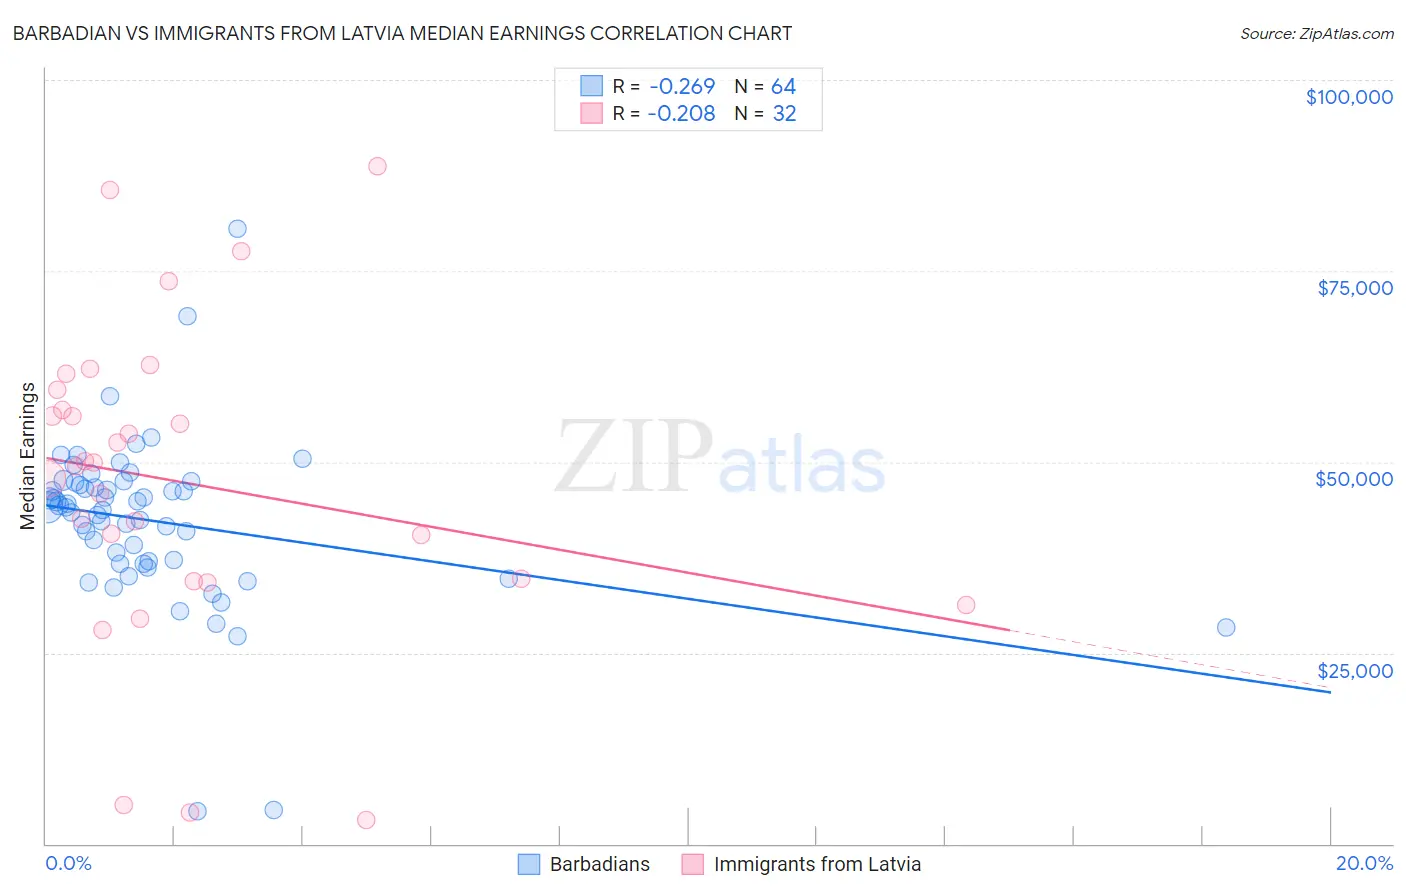
Barbadian vs Immigrants from Latvia Median Earnings Correlation Chart
The statistical analysis conducted on geographies consisting of 141,267,085 people shows a weak negative correlation between the proportion of Barbadians and median earnings in the United States with a correlation coefficient (R) of -0.269 and weighted average of $45,846. Similarly, the statistical analysis conducted on geographies consisting of 113,739,608 people shows a weak negative correlation between the proportion of Immigrants from Latvia and median earnings in the United States with a correlation coefficient (R) of -0.208 and weighted average of $51,555, a difference of 12.4%.
Median Earnings Correlation Summary
| Measurement | Barbadian | Immigrants from Latvia |
| Minimum | $4,250 | $3,188 |
| Maximum | $80,575 | $88,678 |
| Range | $76,325 | $85,490 |
| Mean | $42,285 | $47,322 |
| Median | $44,059 | $49,671 |
| Interquartile 25% (IQ1) | $36,766 | $34,454 |
| Interquartile 75% (IQ3) | $47,124 | $58,094 |
| Interquartile Range (IQR) | $10,358 | $23,640 |
| Standard Deviation (Sample) | $11,063 | $20,618 |
| Standard Deviation (Population) | $10,976 | $20,294 |
Similar Demographics by Median Earnings
Demographics Similar to Barbadians by Median Earnings
In terms of median earnings, the demographic groups most similar to Barbadians are Yugoslavian ($45,846, a difference of 0.0%), Trinidadian and Tobagonian ($45,820, a difference of 0.060%), Immigrants from Barbados ($45,816, a difference of 0.060%), Immigrants from the Azores ($45,812, a difference of 0.070%), and Immigrants from St. Vincent and the Grenadines ($45,908, a difference of 0.14%).
| Demographics | Rating | Rank | Median Earnings |
| French Canadians | 36.1 /100 | #190 | Fair $46,026 |
| Finns | 33.4 /100 | #191 | Fair $45,940 |
| Germans | 33.2 /100 | #192 | Fair $45,935 |
| Guamanians/Chamorros | 33.2 /100 | #193 | Fair $45,933 |
| Immigrants | Costa Rica | 33.0 /100 | #194 | Fair $45,928 |
| Immigrants | St. Vincent and the Grenadines | 32.4 /100 | #195 | Fair $45,908 |
| Yugoslavians | 30.5 /100 | #196 | Fair $45,846 |
| Barbadians | 30.5 /100 | #197 | Fair $45,846 |
| Trinidadians and Tobagonians | 29.7 /100 | #198 | Fair $45,820 |
| Immigrants | Barbados | 29.6 /100 | #199 | Fair $45,816 |
| Immigrants | Azores | 29.5 /100 | #200 | Fair $45,812 |
| Celtics | 27.2 /100 | #201 | Fair $45,732 |
| Immigrants | Trinidad and Tobago | 27.1 /100 | #202 | Fair $45,729 |
| Welsh | 26.6 /100 | #203 | Fair $45,710 |
| Immigrants | Uruguay | 25.9 /100 | #204 | Fair $45,682 |
Demographics Similar to Immigrants from Latvia by Median Earnings
In terms of median earnings, the demographic groups most similar to Immigrants from Latvia are Immigrants from Serbia ($51,557, a difference of 0.0%), Immigrants from Croatia ($51,581, a difference of 0.050%), Immigrants from Bolivia ($51,605, a difference of 0.10%), Immigrants from Eastern Europe ($51,624, a difference of 0.13%), and Immigrants from Pakistan ($51,693, a difference of 0.27%).
| Demographics | Rating | Rank | Median Earnings |
| Immigrants | Indonesia | 99.9 /100 | #54 | Exceptional $51,715 |
| Egyptians | 99.9 /100 | #55 | Exceptional $51,701 |
| Immigrants | Pakistan | 99.9 /100 | #56 | Exceptional $51,693 |
| Immigrants | Eastern Europe | 99.9 /100 | #57 | Exceptional $51,624 |
| Immigrants | Bolivia | 99.9 /100 | #58 | Exceptional $51,605 |
| Immigrants | Croatia | 99.9 /100 | #59 | Exceptional $51,581 |
| Immigrants | Serbia | 99.9 /100 | #60 | Exceptional $51,557 |
| Immigrants | Latvia | 99.9 /100 | #61 | Exceptional $51,555 |
| Immigrants | Romania | 99.9 /100 | #62 | Exceptional $51,337 |
| Immigrants | Bulgaria | 99.9 /100 | #63 | Exceptional $51,318 |
| New Zealanders | 99.9 /100 | #64 | Exceptional $51,246 |
| Greeks | 99.9 /100 | #65 | Exceptional $51,164 |
| Afghans | 99.9 /100 | #66 | Exceptional $51,112 |
| Immigrants | Spain | 99.9 /100 | #67 | Exceptional $51,092 |
| Paraguayans | 99.9 /100 | #68 | Exceptional $51,068 |