Immigrants from South Africa vs Immigrants from Latvia Median Earnings
COMPARE
Immigrants from South Africa
Immigrants from Latvia
Median Earnings
Median Earnings Comparison
Immigrants from South Africa
Immigrants from Latvia
$51,850
MEDIAN EARNINGS
100.0/ 100
METRIC RATING
50th/ 347
METRIC RANK
$51,555
MEDIAN EARNINGS
99.9/ 100
METRIC RATING
61st/ 347
METRIC RANK
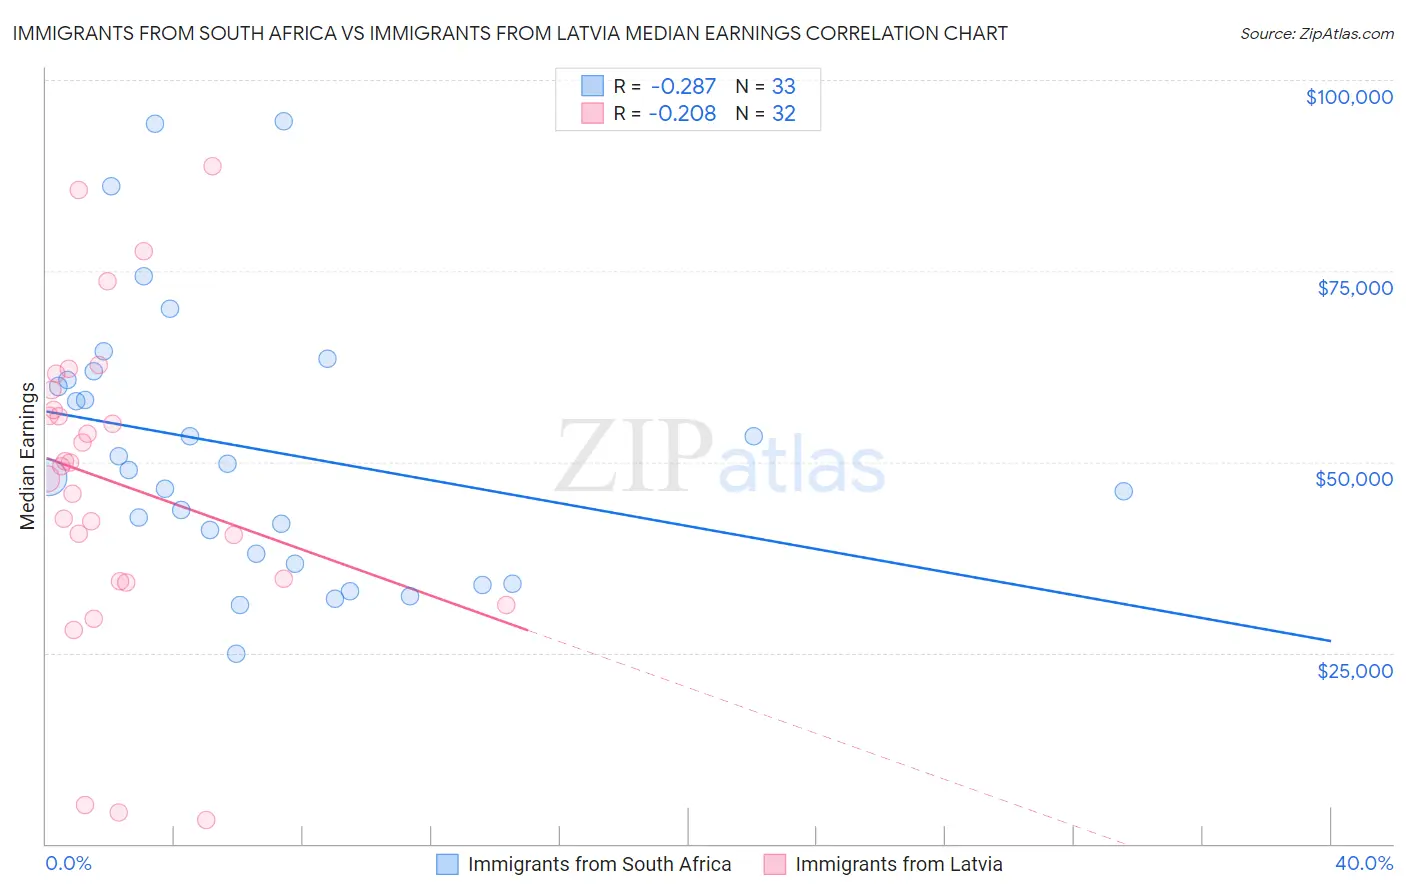
Immigrants from South Africa vs Immigrants from Latvia Median Earnings Correlation Chart
The statistical analysis conducted on geographies consisting of 233,296,995 people shows a weak negative correlation between the proportion of Immigrants from South Africa and median earnings in the United States with a correlation coefficient (R) of -0.287 and weighted average of $51,850. Similarly, the statistical analysis conducted on geographies consisting of 113,739,608 people shows a weak negative correlation between the proportion of Immigrants from Latvia and median earnings in the United States with a correlation coefficient (R) of -0.208 and weighted average of $51,555, a difference of 0.57%.
Median Earnings Correlation Summary
| Measurement | Immigrants from South Africa | Immigrants from Latvia |
| Minimum | $24,853 | $3,188 |
| Maximum | $94,663 | $88,678 |
| Range | $69,810 | $85,490 |
| Mean | $51,765 | $47,322 |
| Median | $48,953 | $49,671 |
| Interquartile 25% (IQ1) | $37,328 | $34,454 |
| Interquartile 75% (IQ3) | $61,361 | $58,094 |
| Interquartile Range (IQR) | $24,033 | $23,640 |
| Standard Deviation (Sample) | $17,731 | $20,618 |
| Standard Deviation (Population) | $17,460 | $20,294 |
Demographics Similar to Immigrants from South Africa and Immigrants from Latvia by Median Earnings
In terms of median earnings, the demographic groups most similar to Immigrants from South Africa are Immigrants from Austria ($51,826, a difference of 0.050%), Estonian ($51,772, a difference of 0.15%), Immigrants from Norway ($51,758, a difference of 0.18%), Immigrants from Indonesia ($51,715, a difference of 0.26%), and Egyptian ($51,701, a difference of 0.29%). Similarly, the demographic groups most similar to Immigrants from Latvia are Immigrants from Serbia ($51,557, a difference of 0.0%), Immigrants from Croatia ($51,581, a difference of 0.050%), Immigrants from Bolivia ($51,605, a difference of 0.10%), Immigrants from Eastern Europe ($51,624, a difference of 0.13%), and Immigrants from Pakistan ($51,693, a difference of 0.27%).
| Demographics | Rating | Rank | Median Earnings |
| Immigrants | Czechoslovakia | 100.0 /100 | #45 | Exceptional $52,361 |
| Bhutanese | 100.0 /100 | #46 | Exceptional $52,297 |
| Australians | 100.0 /100 | #47 | Exceptional $52,294 |
| Immigrants | Europe | 100.0 /100 | #48 | Exceptional $52,195 |
| Bolivians | 100.0 /100 | #49 | Exceptional $52,005 |
| Immigrants | South Africa | 100.0 /100 | #50 | Exceptional $51,850 |
| Immigrants | Austria | 99.9 /100 | #51 | Exceptional $51,826 |
| Estonians | 99.9 /100 | #52 | Exceptional $51,772 |
| Immigrants | Norway | 99.9 /100 | #53 | Exceptional $51,758 |
| Immigrants | Indonesia | 99.9 /100 | #54 | Exceptional $51,715 |
| Egyptians | 99.9 /100 | #55 | Exceptional $51,701 |
| Immigrants | Pakistan | 99.9 /100 | #56 | Exceptional $51,693 |
| Immigrants | Eastern Europe | 99.9 /100 | #57 | Exceptional $51,624 |
| Immigrants | Bolivia | 99.9 /100 | #58 | Exceptional $51,605 |
| Immigrants | Croatia | 99.9 /100 | #59 | Exceptional $51,581 |
| Immigrants | Serbia | 99.9 /100 | #60 | Exceptional $51,557 |
| Immigrants | Latvia | 99.9 /100 | #61 | Exceptional $51,555 |
| Immigrants | Romania | 99.9 /100 | #62 | Exceptional $51,337 |
| Immigrants | Bulgaria | 99.9 /100 | #63 | Exceptional $51,318 |
| New Zealanders | 99.9 /100 | #64 | Exceptional $51,246 |
| Greeks | 99.9 /100 | #65 | Exceptional $51,164 |