Palestinian vs Immigrants from Latvia Median Earnings
COMPARE
Palestinian
Immigrants from Latvia
Median Earnings
Median Earnings Comparison
Palestinians
Immigrants from Latvia
$49,209
MEDIAN EARNINGS
98.0/ 100
METRIC RATING
108th/ 347
METRIC RANK
$51,555
MEDIAN EARNINGS
99.9/ 100
METRIC RATING
61st/ 347
METRIC RANK
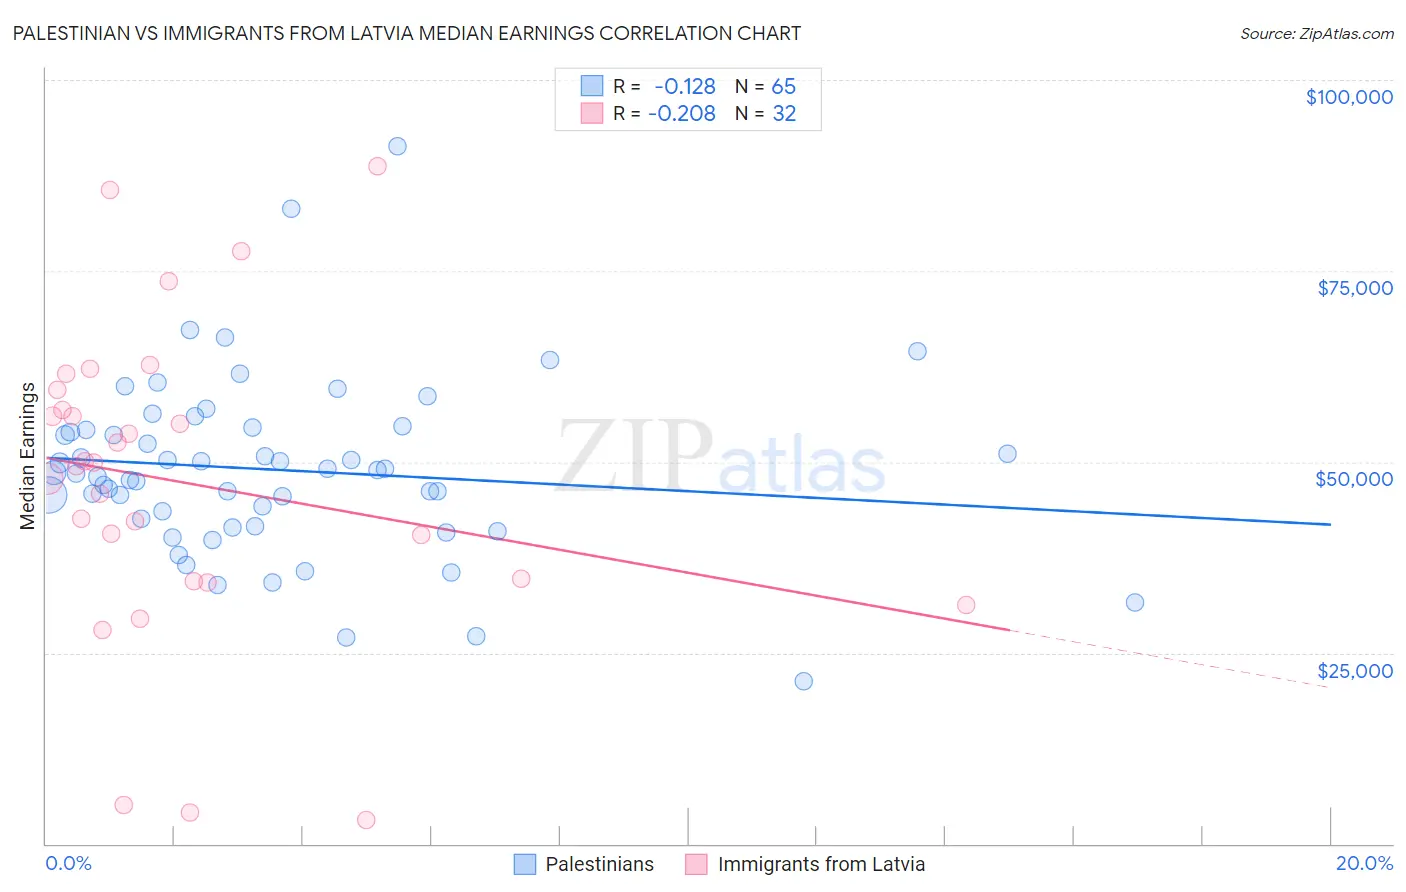
Palestinian vs Immigrants from Latvia Median Earnings Correlation Chart
The statistical analysis conducted on geographies consisting of 216,457,574 people shows a poor negative correlation between the proportion of Palestinians and median earnings in the United States with a correlation coefficient (R) of -0.128 and weighted average of $49,209. Similarly, the statistical analysis conducted on geographies consisting of 113,739,608 people shows a weak negative correlation between the proportion of Immigrants from Latvia and median earnings in the United States with a correlation coefficient (R) of -0.208 and weighted average of $51,555, a difference of 4.8%.
Median Earnings Correlation Summary
| Measurement | Palestinian | Immigrants from Latvia |
| Minimum | $21,204 | $3,188 |
| Maximum | $91,328 | $88,678 |
| Range | $70,124 | $85,490 |
| Mean | $48,950 | $47,322 |
| Median | $48,622 | $49,671 |
| Interquartile 25% (IQ1) | $42,020 | $34,454 |
| Interquartile 75% (IQ3) | $54,336 | $58,094 |
| Interquartile Range (IQR) | $12,316 | $23,640 |
| Standard Deviation (Sample) | $11,660 | $20,618 |
| Standard Deviation (Population) | $11,570 | $20,294 |
Similar Demographics by Median Earnings
Demographics Similar to Palestinians by Median Earnings
In terms of median earnings, the demographic groups most similar to Palestinians are Immigrants from Morocco ($49,368, a difference of 0.32%), Immigrants from Albania ($49,377, a difference of 0.34%), Immigrants from Western Asia ($49,389, a difference of 0.37%), Immigrants from Brazil ($49,463, a difference of 0.52%), and Syrian ($48,934, a difference of 0.56%).
| Demographics | Rating | Rank | Median Earnings |
| Jordanians | 98.9 /100 | #101 | Exceptional $49,632 |
| Ethiopians | 98.8 /100 | #102 | Exceptional $49,572 |
| Austrians | 98.7 /100 | #103 | Exceptional $49,501 |
| Immigrants | Brazil | 98.6 /100 | #104 | Exceptional $49,463 |
| Immigrants | Western Asia | 98.4 /100 | #105 | Exceptional $49,389 |
| Immigrants | Albania | 98.4 /100 | #106 | Exceptional $49,377 |
| Immigrants | Morocco | 98.4 /100 | #107 | Exceptional $49,368 |
| Palestinians | 98.0 /100 | #108 | Exceptional $49,209 |
| Syrians | 97.1 /100 | #109 | Exceptional $48,934 |
| Immigrants | Ethiopia | 97.1 /100 | #110 | Exceptional $48,924 |
| Immigrants | Zimbabwe | 97.0 /100 | #111 | Exceptional $48,913 |
| Northern Europeans | 96.9 /100 | #112 | Exceptional $48,887 |
| Immigrants | Kuwait | 96.8 /100 | #113 | Exceptional $48,861 |
| Moroccans | 96.7 /100 | #114 | Exceptional $48,838 |
| Chinese | 96.7 /100 | #115 | Exceptional $48,836 |
Demographics Similar to Immigrants from Latvia by Median Earnings
In terms of median earnings, the demographic groups most similar to Immigrants from Latvia are Immigrants from Serbia ($51,557, a difference of 0.0%), Immigrants from Croatia ($51,581, a difference of 0.050%), Immigrants from Bolivia ($51,605, a difference of 0.10%), Immigrants from Eastern Europe ($51,624, a difference of 0.13%), and Immigrants from Pakistan ($51,693, a difference of 0.27%).
| Demographics | Rating | Rank | Median Earnings |
| Immigrants | Indonesia | 99.9 /100 | #54 | Exceptional $51,715 |
| Egyptians | 99.9 /100 | #55 | Exceptional $51,701 |
| Immigrants | Pakistan | 99.9 /100 | #56 | Exceptional $51,693 |
| Immigrants | Eastern Europe | 99.9 /100 | #57 | Exceptional $51,624 |
| Immigrants | Bolivia | 99.9 /100 | #58 | Exceptional $51,605 |
| Immigrants | Croatia | 99.9 /100 | #59 | Exceptional $51,581 |
| Immigrants | Serbia | 99.9 /100 | #60 | Exceptional $51,557 |
| Immigrants | Latvia | 99.9 /100 | #61 | Exceptional $51,555 |
| Immigrants | Romania | 99.9 /100 | #62 | Exceptional $51,337 |
| Immigrants | Bulgaria | 99.9 /100 | #63 | Exceptional $51,318 |
| New Zealanders | 99.9 /100 | #64 | Exceptional $51,246 |
| Greeks | 99.9 /100 | #65 | Exceptional $51,164 |
| Afghans | 99.9 /100 | #66 | Exceptional $51,112 |
| Immigrants | Spain | 99.9 /100 | #67 | Exceptional $51,092 |
| Paraguayans | 99.9 /100 | #68 | Exceptional $51,068 |