Puerto Rican vs Iroquois Householder Income Ages 45 - 64 years
COMPARE
Puerto Rican
Iroquois
Householder Income Ages 45 - 64 years
Householder Income Ages 45 - 64 years Comparison
Puerto Ricans
Iroquois
$69,234
HOUSEHOLDER INCOME AGES 45 - 64 YEARS
0.0/ 100
METRIC RATING
346th/ 347
METRIC RANK
$87,255
HOUSEHOLDER INCOME AGES 45 - 64 YEARS
0.1/ 100
METRIC RATING
274th/ 347
METRIC RANK
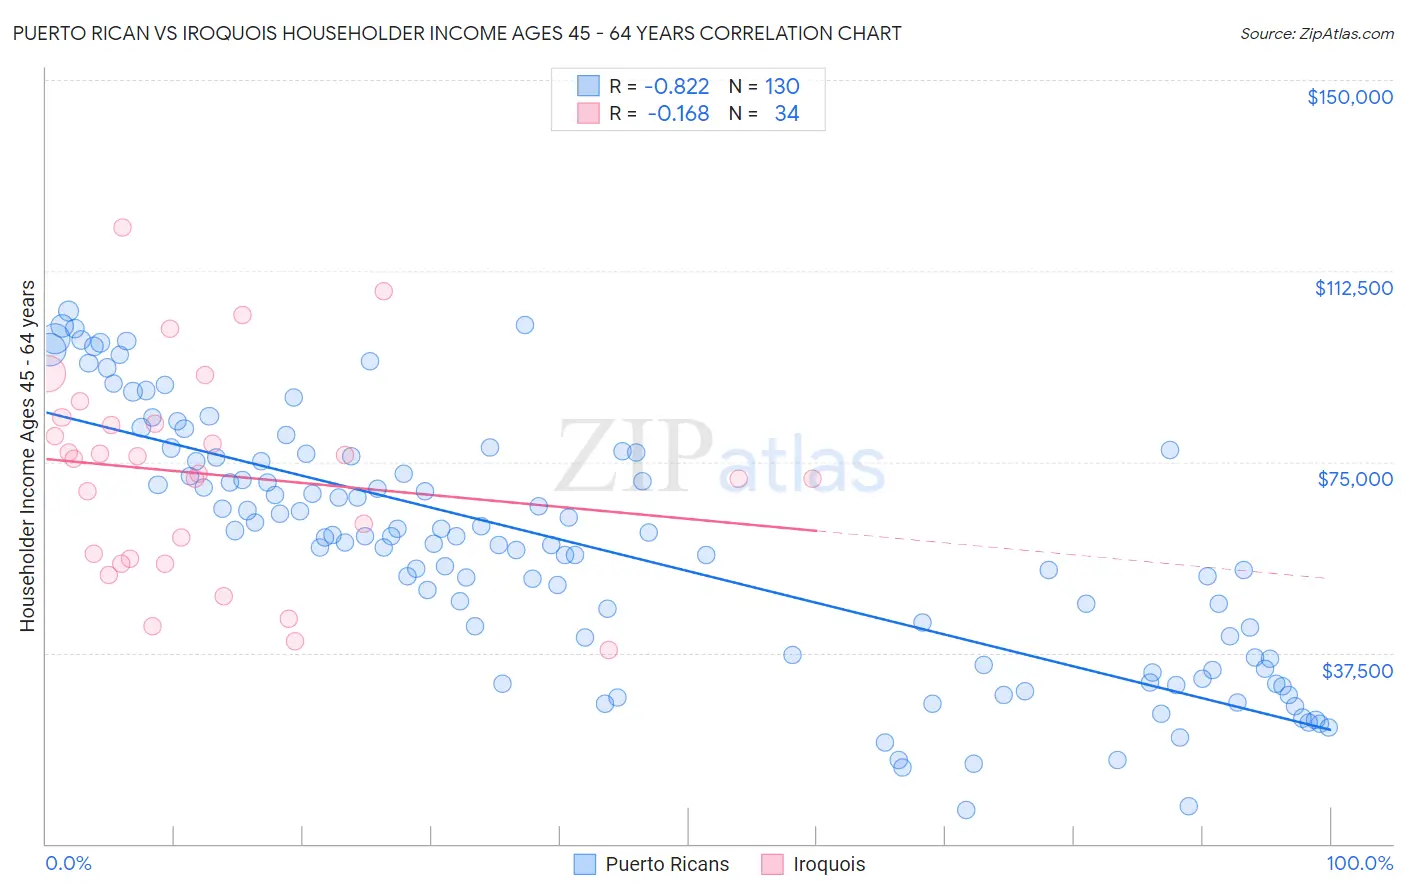
Puerto Rican vs Iroquois Householder Income Ages 45 - 64 years Correlation Chart
The statistical analysis conducted on geographies consisting of 526,175,846 people shows a very strong negative correlation between the proportion of Puerto Ricans and household income with householder between the ages 45 and 64 in the United States with a correlation coefficient (R) of -0.822 and weighted average of $69,234. Similarly, the statistical analysis conducted on geographies consisting of 207,070,070 people shows a poor negative correlation between the proportion of Iroquois and household income with householder between the ages 45 and 64 in the United States with a correlation coefficient (R) of -0.168 and weighted average of $87,255, a difference of 26.0%.
Householder Income Ages 45 - 64 years Correlation Summary
| Measurement | Puerto Rican | Iroquois |
| Minimum | $6,600 | $38,056 |
| Maximum | $104,645 | $121,151 |
| Range | $98,045 | $83,095 |
| Mean | $58,161 | $72,442 |
| Median | $60,296 | $74,085 |
| Interquartile 25% (IQ1) | $36,266 | $55,882 |
| Interquartile 75% (IQ3) | $75,781 | $82,434 |
| Interquartile Range (IQR) | $39,515 | $26,552 |
| Standard Deviation (Sample) | $24,341 | $20,014 |
| Standard Deviation (Population) | $24,247 | $19,717 |
Similar Demographics by Householder Income Ages 45 - 64 years
Demographics Similar to Puerto Ricans by Householder Income Ages 45 - 64 years
In terms of householder income ages 45 - 64 years, the demographic groups most similar to Puerto Ricans are Navajo ($69,759, a difference of 0.76%), Houma ($72,093, a difference of 4.1%), Pima ($73,365, a difference of 6.0%), Lumbee ($65,113, a difference of 6.3%), and Tohono O'odham ($73,774, a difference of 6.6%).
| Demographics | Rating | Rank | Householder Income Ages 45 - 64 years |
| Immigrants | Congo | 0.0 /100 | #333 | Tragic $77,850 |
| Menominee | 0.0 /100 | #334 | Tragic $76,903 |
| Cheyenne | 0.0 /100 | #335 | Tragic $76,362 |
| Arapaho | 0.0 /100 | #336 | Tragic $75,945 |
| Pueblo | 0.0 /100 | #337 | Tragic $75,601 |
| Hopi | 0.0 /100 | #338 | Tragic $75,562 |
| Kiowa | 0.0 /100 | #339 | Tragic $74,815 |
| Immigrants | Yemen | 0.0 /100 | #340 | Tragic $74,575 |
| Crow | 0.0 /100 | #341 | Tragic $74,257 |
| Tohono O'odham | 0.0 /100 | #342 | Tragic $73,774 |
| Pima | 0.0 /100 | #343 | Tragic $73,365 |
| Houma | 0.0 /100 | #344 | Tragic $72,093 |
| Navajo | 0.0 /100 | #345 | Tragic $69,759 |
| Puerto Ricans | 0.0 /100 | #346 | Tragic $69,234 |
| Lumbee | 0.0 /100 | #347 | Tragic $65,113 |
Demographics Similar to Iroquois by Householder Income Ages 45 - 64 years
In terms of householder income ages 45 - 64 years, the demographic groups most similar to Iroquois are Immigrants from Belize ($87,229, a difference of 0.030%), Immigrants from Latin America ($87,219, a difference of 0.040%), Cree ($87,185, a difference of 0.080%), Immigrants from Jamaica ($87,035, a difference of 0.25%), and Yakama ($86,992, a difference of 0.30%).
| Demographics | Rating | Rank | Householder Income Ages 45 - 64 years |
| Hmong | 0.2 /100 | #267 | Tragic $88,115 |
| Immigrants | Micronesia | 0.2 /100 | #268 | Tragic $87,864 |
| Spanish Americans | 0.2 /100 | #269 | Tragic $87,836 |
| Immigrants | Liberia | 0.2 /100 | #270 | Tragic $87,739 |
| Guatemalans | 0.2 /100 | #271 | Tragic $87,705 |
| Cape Verdeans | 0.2 /100 | #272 | Tragic $87,580 |
| Spanish American Indians | 0.2 /100 | #273 | Tragic $87,561 |
| Iroquois | 0.1 /100 | #274 | Tragic $87,255 |
| Immigrants | Belize | 0.1 /100 | #275 | Tragic $87,229 |
| Immigrants | Latin America | 0.1 /100 | #276 | Tragic $87,219 |
| Cree | 0.1 /100 | #277 | Tragic $87,185 |
| Immigrants | Jamaica | 0.1 /100 | #278 | Tragic $87,035 |
| Yakama | 0.1 /100 | #279 | Tragic $86,992 |
| Immigrants | Somalia | 0.1 /100 | #280 | Tragic $86,987 |
| Yaqui | 0.1 /100 | #281 | Tragic $86,914 |