Nonimmigrants vs Iroquois Householder Income Ages 45 - 64 years
COMPARE
Nonimmigrants
Iroquois
Householder Income Ages 45 - 64 years
Householder Income Ages 45 - 64 years Comparison
Nonimmigrants
Iroquois
$94,448
HOUSEHOLDER INCOME AGES 45 - 64 YEARS
5.0/ 100
METRIC RATING
223rd/ 347
METRIC RANK
$87,255
HOUSEHOLDER INCOME AGES 45 - 64 YEARS
0.1/ 100
METRIC RATING
274th/ 347
METRIC RANK
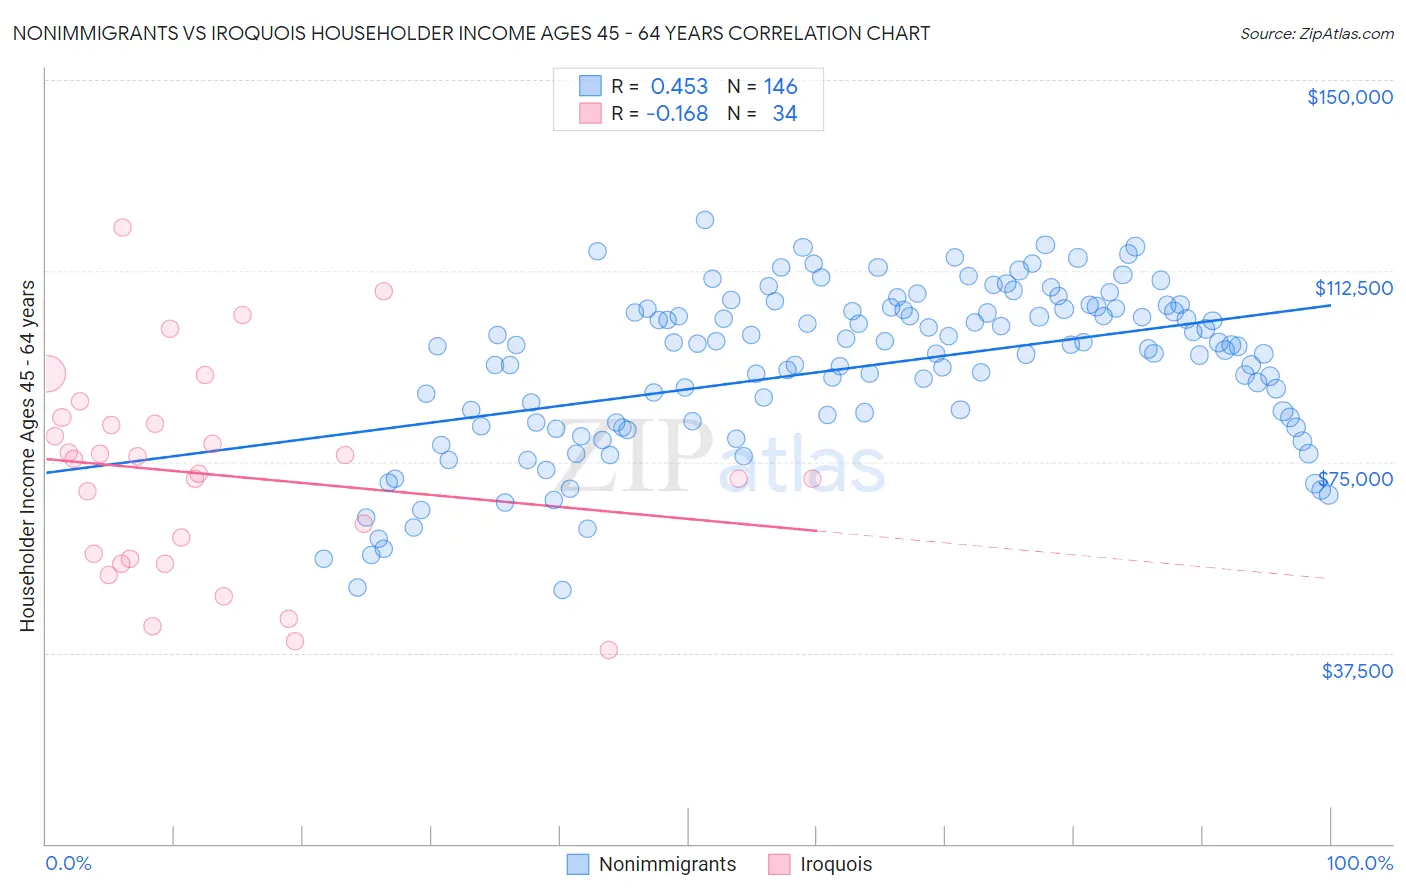
Nonimmigrants vs Iroquois Householder Income Ages 45 - 64 years Correlation Chart
The statistical analysis conducted on geographies consisting of 578,858,945 people shows a moderate positive correlation between the proportion of Nonimmigrants and household income with householder between the ages 45 and 64 in the United States with a correlation coefficient (R) of 0.453 and weighted average of $94,448. Similarly, the statistical analysis conducted on geographies consisting of 207,070,070 people shows a poor negative correlation between the proportion of Iroquois and household income with householder between the ages 45 and 64 in the United States with a correlation coefficient (R) of -0.168 and weighted average of $87,255, a difference of 8.2%.
Householder Income Ages 45 - 64 years Correlation Summary
| Measurement | Nonimmigrants | Iroquois |
| Minimum | $49,742 | $38,056 |
| Maximum | $122,626 | $121,151 |
| Range | $72,884 | $83,095 |
| Mean | $93,614 | $72,442 |
| Median | $97,642 | $74,085 |
| Interquartile 25% (IQ1) | $82,744 | $55,882 |
| Interquartile 75% (IQ3) | $104,952 | $82,434 |
| Interquartile Range (IQR) | $22,209 | $26,552 |
| Standard Deviation (Sample) | $15,816 | $20,014 |
| Standard Deviation (Population) | $15,762 | $19,717 |
Similar Demographics by Householder Income Ages 45 - 64 years
Demographics Similar to Nonimmigrants by Householder Income Ages 45 - 64 years
In terms of householder income ages 45 - 64 years, the demographic groups most similar to Nonimmigrants are Malaysian ($94,517, a difference of 0.070%), Immigrants from Bosnia and Herzegovina ($94,288, a difference of 0.17%), Bermudan ($94,197, a difference of 0.27%), Immigrants from the Azores ($94,138, a difference of 0.33%), and Immigrants from Nigeria ($94,804, a difference of 0.38%).
| Demographics | Rating | Rank | Householder Income Ages 45 - 64 years |
| Immigrants | Venezuela | 7.6 /100 | #216 | Tragic $95,342 |
| Immigrants | Ghana | 6.4 /100 | #217 | Tragic $94,982 |
| Delaware | 6.2 /100 | #218 | Tragic $94,914 |
| Immigrants | Armenia | 6.1 /100 | #219 | Tragic $94,863 |
| Salvadorans | 6.0 /100 | #220 | Tragic $94,842 |
| Immigrants | Nigeria | 5.9 /100 | #221 | Tragic $94,804 |
| Malaysians | 5.2 /100 | #222 | Tragic $94,517 |
| Immigrants | Nonimmigrants | 5.0 /100 | #223 | Tragic $94,448 |
| Immigrants | Bosnia and Herzegovina | 4.6 /100 | #224 | Tragic $94,288 |
| Bermudans | 4.4 /100 | #225 | Tragic $94,197 |
| Immigrants | Azores | 4.3 /100 | #226 | Tragic $94,138 |
| Alaska Natives | 4.0 /100 | #227 | Tragic $93,991 |
| Immigrants | Panama | 3.7 /100 | #228 | Tragic $93,815 |
| Vietnamese | 3.6 /100 | #229 | Tragic $93,788 |
| Immigrants | Sudan | 3.6 /100 | #230 | Tragic $93,781 |
Demographics Similar to Iroquois by Householder Income Ages 45 - 64 years
In terms of householder income ages 45 - 64 years, the demographic groups most similar to Iroquois are Immigrants from Belize ($87,229, a difference of 0.030%), Immigrants from Latin America ($87,219, a difference of 0.040%), Cree ($87,185, a difference of 0.080%), Immigrants from Jamaica ($87,035, a difference of 0.25%), and Yakama ($86,992, a difference of 0.30%).
| Demographics | Rating | Rank | Householder Income Ages 45 - 64 years |
| Hmong | 0.2 /100 | #267 | Tragic $88,115 |
| Immigrants | Micronesia | 0.2 /100 | #268 | Tragic $87,864 |
| Spanish Americans | 0.2 /100 | #269 | Tragic $87,836 |
| Immigrants | Liberia | 0.2 /100 | #270 | Tragic $87,739 |
| Guatemalans | 0.2 /100 | #271 | Tragic $87,705 |
| Cape Verdeans | 0.2 /100 | #272 | Tragic $87,580 |
| Spanish American Indians | 0.2 /100 | #273 | Tragic $87,561 |
| Iroquois | 0.1 /100 | #274 | Tragic $87,255 |
| Immigrants | Belize | 0.1 /100 | #275 | Tragic $87,229 |
| Immigrants | Latin America | 0.1 /100 | #276 | Tragic $87,219 |
| Cree | 0.1 /100 | #277 | Tragic $87,185 |
| Immigrants | Jamaica | 0.1 /100 | #278 | Tragic $87,035 |
| Yakama | 0.1 /100 | #279 | Tragic $86,992 |
| Immigrants | Somalia | 0.1 /100 | #280 | Tragic $86,987 |
| Yaqui | 0.1 /100 | #281 | Tragic $86,914 |