Aleut vs Northern European Householder Income Ages 45 - 64 years
COMPARE
Aleut
Northern European
Householder Income Ages 45 - 64 years
Householder Income Ages 45 - 64 years Comparison
Aleuts
Northern Europeans
$100,052
HOUSEHOLDER INCOME AGES 45 - 64 YEARS
46.6/ 100
METRIC RATING
180th/ 347
METRIC RANK
$107,870
HOUSEHOLDER INCOME AGES 45 - 64 YEARS
97.8/ 100
METRIC RATING
97th/ 347
METRIC RANK
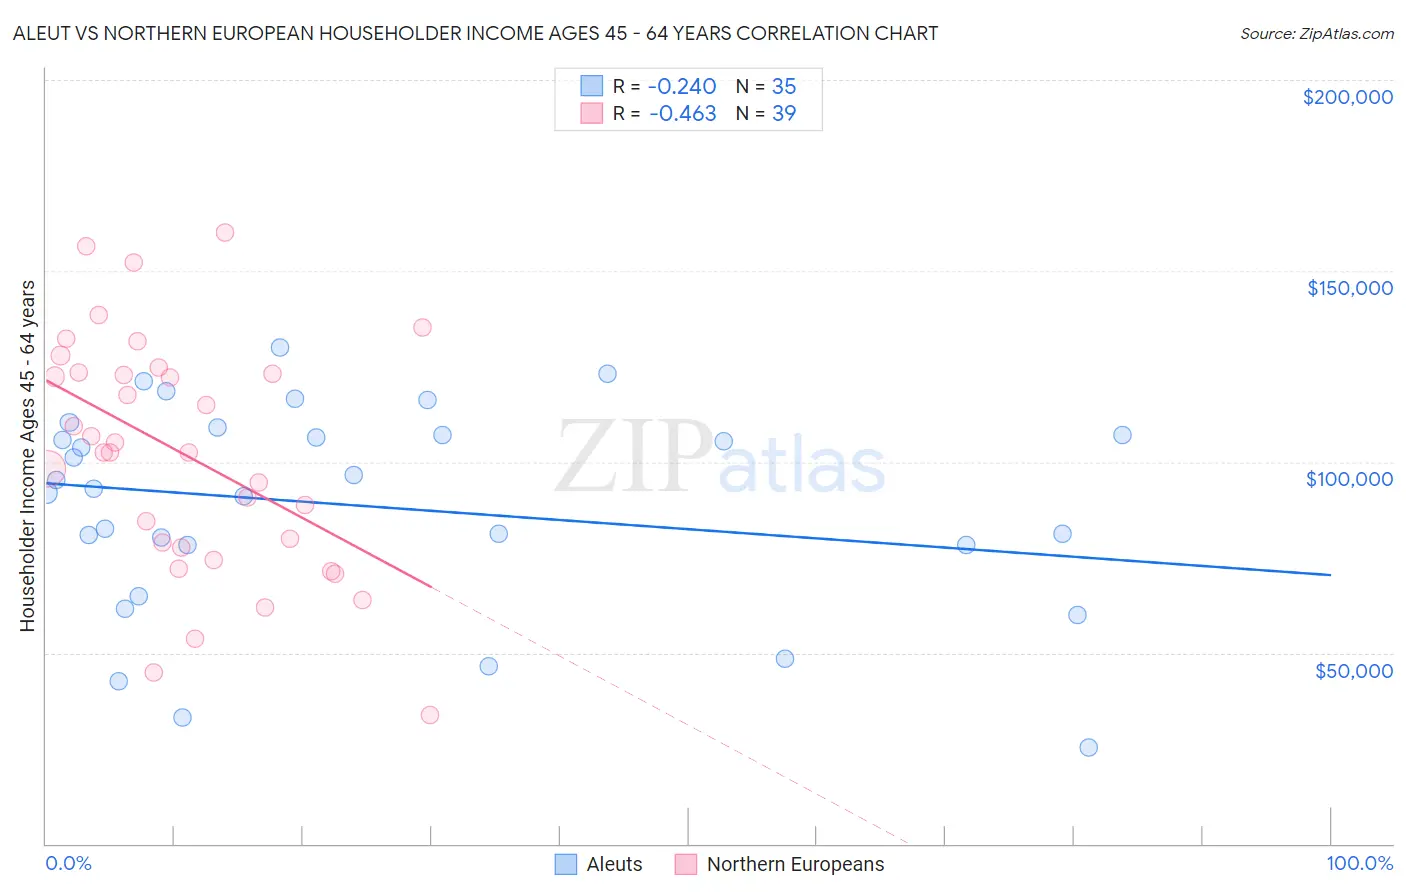
Aleut vs Northern European Householder Income Ages 45 - 64 years Correlation Chart
The statistical analysis conducted on geographies consisting of 61,745,960 people shows a weak negative correlation between the proportion of Aleuts and household income with householder between the ages 45 and 64 in the United States with a correlation coefficient (R) of -0.240 and weighted average of $100,052. Similarly, the statistical analysis conducted on geographies consisting of 405,435,990 people shows a moderate negative correlation between the proportion of Northern Europeans and household income with householder between the ages 45 and 64 in the United States with a correlation coefficient (R) of -0.463 and weighted average of $107,870, a difference of 7.8%.
Householder Income Ages 45 - 64 years Correlation Summary
| Measurement | Aleut | Northern European |
| Minimum | $25,250 | $33,594 |
| Maximum | $130,063 | $160,179 |
| Range | $104,813 | $126,585 |
| Mean | $88,376 | $101,869 |
| Median | $92,906 | $102,539 |
| Interquartile 25% (IQ1) | $78,125 | $77,586 |
| Interquartile 75% (IQ3) | $107,188 | $123,289 |
| Interquartile Range (IQR) | $29,063 | $45,703 |
| Standard Deviation (Sample) | $26,902 | $30,827 |
| Standard Deviation (Population) | $26,515 | $30,430 |
Similar Demographics by Householder Income Ages 45 - 64 years
Demographics Similar to Aleuts by Householder Income Ages 45 - 64 years
In terms of householder income ages 45 - 64 years, the demographic groups most similar to Aleuts are Belgian ($100,060, a difference of 0.010%), Immigrants from Cameroon ($100,084, a difference of 0.030%), Immigrants from Costa Rica ($100,141, a difference of 0.090%), Moroccan ($100,138, a difference of 0.090%), and Immigrants ($99,943, a difference of 0.11%).
| Demographics | Rating | Rank | Householder Income Ages 45 - 64 years |
| Alsatians | 51.4 /100 | #173 | Average $100,435 |
| Welsh | 50.0 /100 | #174 | Average $100,322 |
| Germans | 48.8 /100 | #175 | Average $100,224 |
| Immigrants | Costa Rica | 47.7 /100 | #176 | Average $100,141 |
| Moroccans | 47.7 /100 | #177 | Average $100,138 |
| Immigrants | Cameroon | 47.0 /100 | #178 | Average $100,084 |
| Belgians | 46.7 /100 | #179 | Average $100,060 |
| Aleuts | 46.6 /100 | #180 | Average $100,052 |
| Immigrants | Immigrants | 45.3 /100 | #181 | Average $99,943 |
| Finns | 44.8 /100 | #182 | Average $99,904 |
| Spaniards | 44.6 /100 | #183 | Average $99,889 |
| French | 43.8 /100 | #184 | Average $99,824 |
| Colombians | 43.2 /100 | #185 | Average $99,772 |
| Dutch | 41.7 /100 | #186 | Average $99,650 |
| Iraqis | 38.5 /100 | #187 | Fair $99,387 |
Demographics Similar to Northern Europeans by Householder Income Ages 45 - 64 years
In terms of householder income ages 45 - 64 years, the demographic groups most similar to Northern Europeans are Immigrants from Southern Europe ($107,775, a difference of 0.090%), Palestinian ($107,721, a difference of 0.14%), Immigrants from Serbia ($107,569, a difference of 0.28%), Sri Lankan ($108,270, a difference of 0.37%), and Immigrants from Hungary ($108,267, a difference of 0.37%).
| Demographics | Rating | Rank | Householder Income Ages 45 - 64 years |
| Immigrants | Philippines | 98.3 /100 | #90 | Exceptional $108,471 |
| Immigrants | Lebanon | 98.3 /100 | #91 | Exceptional $108,471 |
| Croatians | 98.3 /100 | #92 | Exceptional $108,383 |
| Immigrants | Croatia | 98.2 /100 | #93 | Exceptional $108,304 |
| Sri Lankans | 98.2 /100 | #94 | Exceptional $108,270 |
| Immigrants | Hungary | 98.2 /100 | #95 | Exceptional $108,267 |
| Immigrants | Argentina | 98.2 /100 | #96 | Exceptional $108,264 |
| Northern Europeans | 97.8 /100 | #97 | Exceptional $107,870 |
| Immigrants | Southern Europe | 97.7 /100 | #98 | Exceptional $107,775 |
| Palestinians | 97.6 /100 | #99 | Exceptional $107,721 |
| Immigrants | Serbia | 97.4 /100 | #100 | Exceptional $107,569 |
| Immigrants | Kazakhstan | 97.2 /100 | #101 | Exceptional $107,378 |
| Immigrants | Moldova | 97.1 /100 | #102 | Exceptional $107,357 |
| Syrians | 96.9 /100 | #103 | Exceptional $107,207 |
| Immigrants | Ukraine | 96.7 /100 | #104 | Exceptional $107,079 |