Aleut vs Immigrants from Haiti Householder Income Ages 45 - 64 years
COMPARE
Aleut
Immigrants from Haiti
Householder Income Ages 45 - 64 years
Householder Income Ages 45 - 64 years Comparison
Aleuts
Immigrants from Haiti
$100,052
HOUSEHOLDER INCOME AGES 45 - 64 YEARS
46.6/ 100
METRIC RATING
180th/ 347
METRIC RANK
$83,257
HOUSEHOLDER INCOME AGES 45 - 64 YEARS
0.0/ 100
METRIC RATING
310th/ 347
METRIC RANK
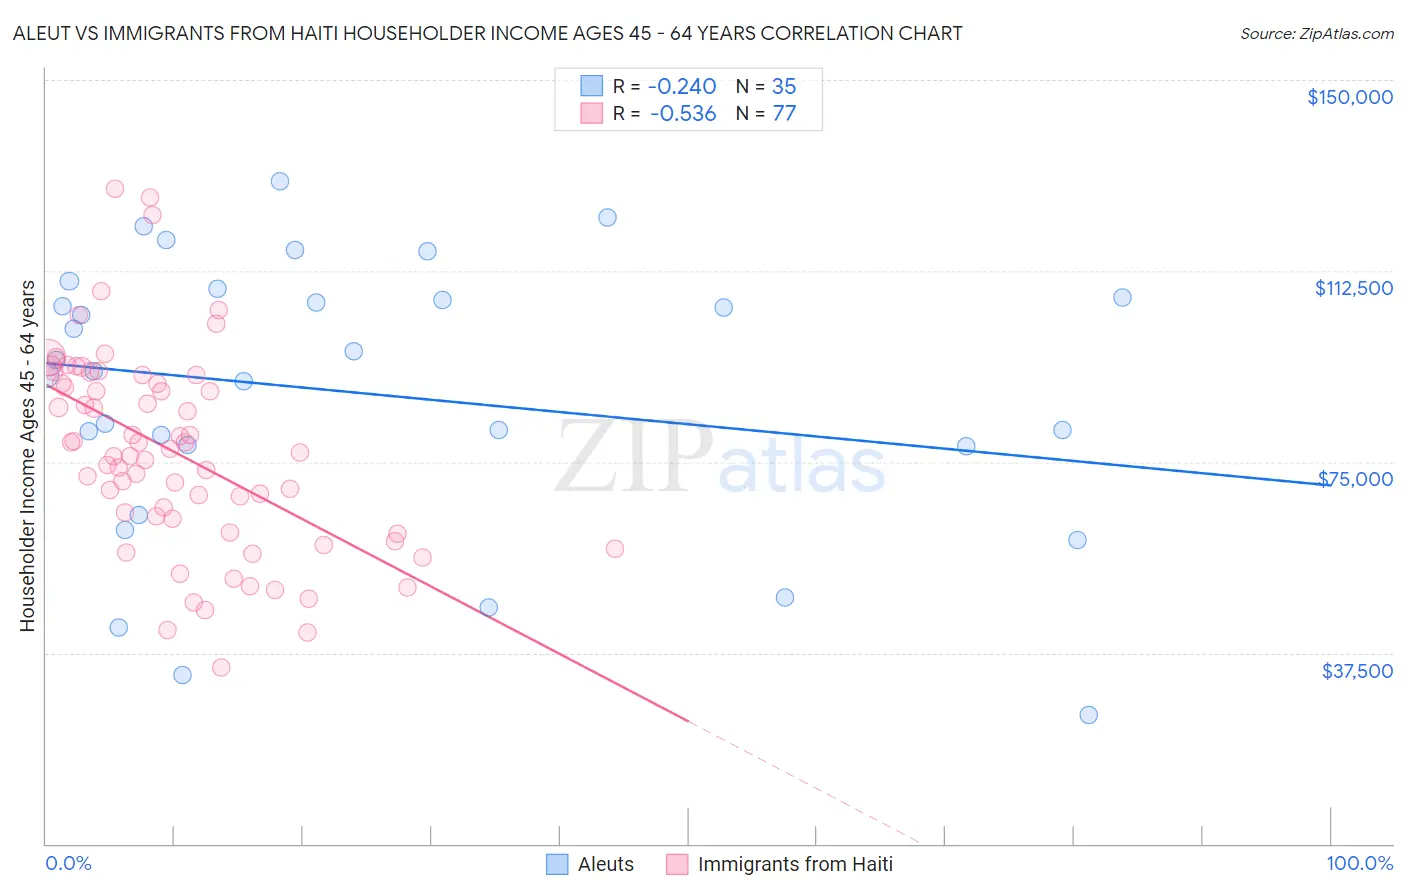
Aleut vs Immigrants from Haiti Householder Income Ages 45 - 64 years Correlation Chart
The statistical analysis conducted on geographies consisting of 61,745,960 people shows a weak negative correlation between the proportion of Aleuts and household income with householder between the ages 45 and 64 in the United States with a correlation coefficient (R) of -0.240 and weighted average of $100,052. Similarly, the statistical analysis conducted on geographies consisting of 225,001,886 people shows a substantial negative correlation between the proportion of Immigrants from Haiti and household income with householder between the ages 45 and 64 in the United States with a correlation coefficient (R) of -0.536 and weighted average of $83,257, a difference of 20.2%.
Householder Income Ages 45 - 64 years Correlation Summary
| Measurement | Aleut | Immigrants from Haiti |
| Minimum | $25,250 | $34,634 |
| Maximum | $130,063 | $128,551 |
| Range | $104,813 | $93,917 |
| Mean | $88,376 | $76,930 |
| Median | $92,906 | $76,731 |
| Interquartile 25% (IQ1) | $78,125 | $62,422 |
| Interquartile 75% (IQ3) | $107,188 | $91,231 |
| Interquartile Range (IQR) | $29,063 | $28,809 |
| Standard Deviation (Sample) | $26,902 | $19,640 |
| Standard Deviation (Population) | $26,515 | $19,512 |
Similar Demographics by Householder Income Ages 45 - 64 years
Demographics Similar to Aleuts by Householder Income Ages 45 - 64 years
In terms of householder income ages 45 - 64 years, the demographic groups most similar to Aleuts are Belgian ($100,060, a difference of 0.010%), Immigrants from Cameroon ($100,084, a difference of 0.030%), Immigrants from Costa Rica ($100,141, a difference of 0.090%), Moroccan ($100,138, a difference of 0.090%), and Immigrants ($99,943, a difference of 0.11%).
| Demographics | Rating | Rank | Householder Income Ages 45 - 64 years |
| Alsatians | 51.4 /100 | #173 | Average $100,435 |
| Welsh | 50.0 /100 | #174 | Average $100,322 |
| Germans | 48.8 /100 | #175 | Average $100,224 |
| Immigrants | Costa Rica | 47.7 /100 | #176 | Average $100,141 |
| Moroccans | 47.7 /100 | #177 | Average $100,138 |
| Immigrants | Cameroon | 47.0 /100 | #178 | Average $100,084 |
| Belgians | 46.7 /100 | #179 | Average $100,060 |
| Aleuts | 46.6 /100 | #180 | Average $100,052 |
| Immigrants | Immigrants | 45.3 /100 | #181 | Average $99,943 |
| Finns | 44.8 /100 | #182 | Average $99,904 |
| Spaniards | 44.6 /100 | #183 | Average $99,889 |
| French | 43.8 /100 | #184 | Average $99,824 |
| Colombians | 43.2 /100 | #185 | Average $99,772 |
| Dutch | 41.7 /100 | #186 | Average $99,650 |
| Iraqis | 38.5 /100 | #187 | Fair $99,387 |
Demographics Similar to Immigrants from Haiti by Householder Income Ages 45 - 64 years
In terms of householder income ages 45 - 64 years, the demographic groups most similar to Immigrants from Haiti are Immigrants from Dominica ($83,311, a difference of 0.060%), Immigrants from Bahamas ($83,177, a difference of 0.10%), Cajun ($83,015, a difference of 0.29%), Immigrants from Cabo Verde ($83,542, a difference of 0.34%), and Shoshone ($83,588, a difference of 0.40%).
| Demographics | Rating | Rank | Householder Income Ages 45 - 64 years |
| Hondurans | 0.0 /100 | #303 | Tragic $84,079 |
| Ottawa | 0.0 /100 | #304 | Tragic $83,953 |
| Chippewa | 0.0 /100 | #305 | Tragic $83,943 |
| Ute | 0.0 /100 | #306 | Tragic $83,937 |
| Shoshone | 0.0 /100 | #307 | Tragic $83,588 |
| Immigrants | Cabo Verde | 0.0 /100 | #308 | Tragic $83,542 |
| Immigrants | Dominica | 0.0 /100 | #309 | Tragic $83,311 |
| Immigrants | Haiti | 0.0 /100 | #310 | Tragic $83,257 |
| Immigrants | Bahamas | 0.0 /100 | #311 | Tragic $83,177 |
| Cajuns | 0.0 /100 | #312 | Tragic $83,015 |
| U.S. Virgin Islanders | 0.0 /100 | #313 | Tragic $82,736 |
| Immigrants | Honduras | 0.0 /100 | #314 | Tragic $82,697 |
| Paiute | 0.0 /100 | #315 | Tragic $82,629 |
| Immigrants | Caribbean | 0.0 /100 | #316 | Tragic $82,513 |
| Colville | 0.0 /100 | #317 | Tragic $82,474 |