Hmong vs Immigrants from Kazakhstan Median Female Earnings
COMPARE
Hmong
Immigrants from Kazakhstan
Median Female Earnings
Median Female Earnings Comparison
Hmong
Immigrants from Kazakhstan
$35,498
MEDIAN FEMALE EARNINGS
0.0/ 100
METRIC RATING
297th/ 347
METRIC RANK
$42,386
MEDIAN FEMALE EARNINGS
99.6/ 100
METRIC RATING
78th/ 347
METRIC RANK
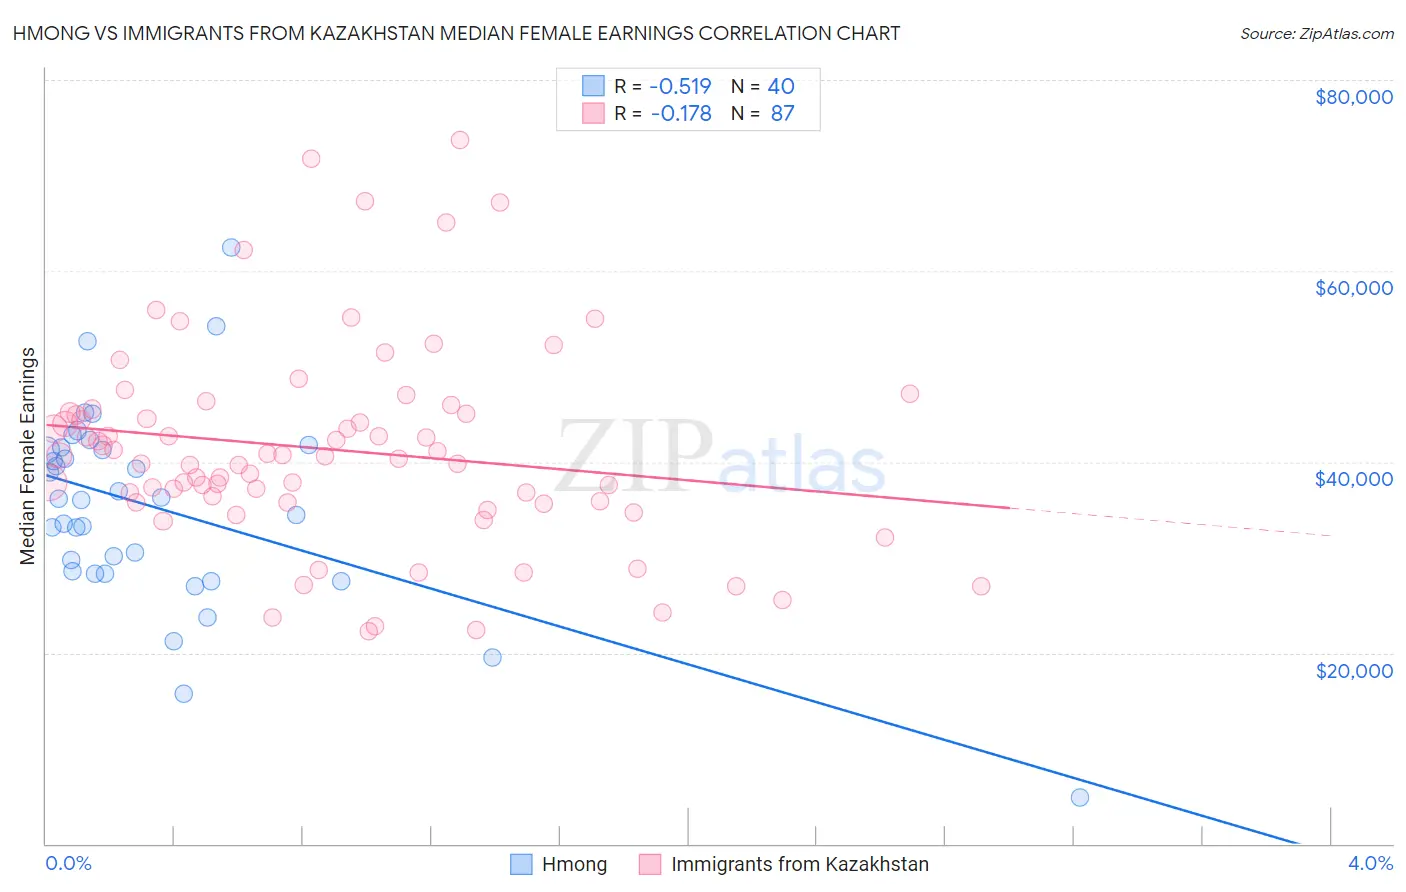
Hmong vs Immigrants from Kazakhstan Median Female Earnings Correlation Chart
The statistical analysis conducted on geographies consisting of 24,681,537 people shows a substantial negative correlation between the proportion of Hmong and median female earnings in the United States with a correlation coefficient (R) of -0.519 and weighted average of $35,498. Similarly, the statistical analysis conducted on geographies consisting of 124,420,092 people shows a poor negative correlation between the proportion of Immigrants from Kazakhstan and median female earnings in the United States with a correlation coefficient (R) of -0.178 and weighted average of $42,386, a difference of 19.4%.
Median Female Earnings Correlation Summary
| Measurement | Hmong | Immigrants from Kazakhstan |
| Minimum | $4,844 | $22,250 |
| Maximum | $62,438 | $73,684 |
| Range | $57,594 | $51,434 |
| Mean | $35,172 | $41,300 |
| Median | $36,091 | $40,614 |
| Interquartile 25% (IQ1) | $28,415 | $35,762 |
| Interquartile 75% (IQ3) | $41,366 | $45,166 |
| Interquartile Range (IQR) | $12,951 | $9,404 |
| Standard Deviation (Sample) | $10,537 | $10,623 |
| Standard Deviation (Population) | $10,404 | $10,562 |
Similar Demographics by Median Female Earnings
Demographics Similar to Hmong by Median Female Earnings
In terms of median female earnings, the demographic groups most similar to Hmong are Immigrants from Micronesia ($35,477, a difference of 0.060%), Immigrants from Guatemala ($35,444, a difference of 0.15%), Yuman ($35,377, a difference of 0.34%), Mexican American Indian ($35,629, a difference of 0.37%), and Comanche ($35,661, a difference of 0.46%).
| Demographics | Rating | Rank | Median Female Earnings |
| Central American Indians | 0.0 /100 | #290 | Tragic $35,930 |
| Blackfeet | 0.0 /100 | #291 | Tragic $35,864 |
| Americans | 0.0 /100 | #292 | Tragic $35,777 |
| Guatemalans | 0.0 /100 | #293 | Tragic $35,695 |
| Cheyenne | 0.0 /100 | #294 | Tragic $35,673 |
| Comanche | 0.0 /100 | #295 | Tragic $35,661 |
| Mexican American Indians | 0.0 /100 | #296 | Tragic $35,629 |
| Hmong | 0.0 /100 | #297 | Tragic $35,498 |
| Immigrants | Micronesia | 0.0 /100 | #298 | Tragic $35,477 |
| Immigrants | Guatemala | 0.0 /100 | #299 | Tragic $35,444 |
| Yuman | 0.0 /100 | #300 | Tragic $35,377 |
| Pima | 0.0 /100 | #301 | Tragic $35,326 |
| Blacks/African Americans | 0.0 /100 | #302 | Tragic $35,315 |
| Immigrants | Latin America | 0.0 /100 | #303 | Tragic $35,307 |
| Crow | 0.0 /100 | #304 | Tragic $35,266 |
Demographics Similar to Immigrants from Kazakhstan by Median Female Earnings
In terms of median female earnings, the demographic groups most similar to Immigrants from Kazakhstan are Immigrants from Albania ($42,388, a difference of 0.0%), Greek ($42,336, a difference of 0.12%), New Zealander ($42,446, a difference of 0.14%), Immigrants from Italy ($42,446, a difference of 0.14%), and Immigrants from Moldova ($42,304, a difference of 0.19%).
| Demographics | Rating | Rank | Median Female Earnings |
| Immigrants | Romania | 99.8 /100 | #71 | Exceptional $42,718 |
| Albanians | 99.8 /100 | #72 | Exceptional $42,584 |
| Mongolians | 99.7 /100 | #73 | Exceptional $42,542 |
| Immigrants | South Africa | 99.7 /100 | #74 | Exceptional $42,508 |
| New Zealanders | 99.7 /100 | #75 | Exceptional $42,446 |
| Immigrants | Italy | 99.7 /100 | #76 | Exceptional $42,446 |
| Immigrants | Albania | 99.6 /100 | #77 | Exceptional $42,388 |
| Immigrants | Kazakhstan | 99.6 /100 | #78 | Exceptional $42,386 |
| Greeks | 99.6 /100 | #79 | Exceptional $42,336 |
| Immigrants | Moldova | 99.6 /100 | #80 | Exceptional $42,304 |
| Immigrants | Southern Europe | 99.5 /100 | #81 | Exceptional $42,275 |
| Immigrants | Morocco | 99.5 /100 | #82 | Exceptional $42,229 |
| Immigrants | Sierra Leone | 99.5 /100 | #83 | Exceptional $42,214 |
| Armenians | 99.5 /100 | #84 | Exceptional $42,212 |
| Laotians | 99.4 /100 | #85 | Exceptional $42,133 |