Trinidadian and Tobagonian vs Immigrants from Trinidad and Tobago Median Household Income
COMPARE
Trinidadian and Tobagonian
Immigrants from Trinidad and Tobago
Median Household Income
Median Household Income Comparison
Trinidadians and Tobagonians
Immigrants from Trinidad and Tobago
$80,402
MEDIAN HOUSEHOLD INCOME
4.7/ 100
METRIC RATING
231st/ 347
METRIC RANK
$80,373
MEDIAN HOUSEHOLD INCOME
4.6/ 100
METRIC RATING
232nd/ 347
METRIC RANK
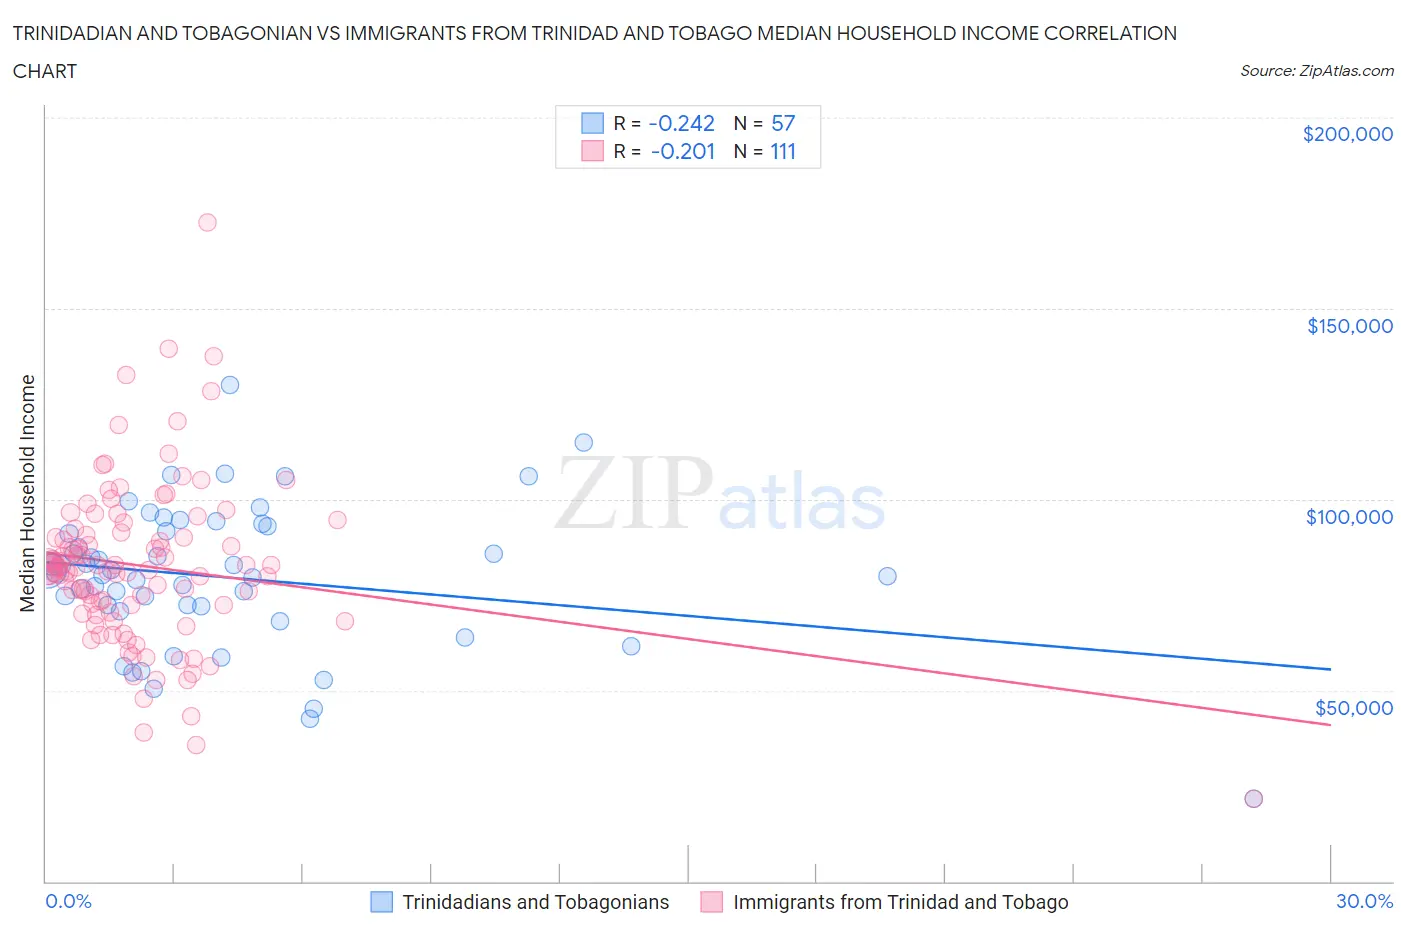
Trinidadian and Tobagonian vs Immigrants from Trinidad and Tobago Median Household Income Correlation Chart
The statistical analysis conducted on geographies consisting of 219,662,857 people shows a weak negative correlation between the proportion of Trinidadians and Tobagonians and median household income in the United States with a correlation coefficient (R) of -0.242 and weighted average of $80,402. Similarly, the statistical analysis conducted on geographies consisting of 223,468,612 people shows a weak negative correlation between the proportion of Immigrants from Trinidad and Tobago and median household income in the United States with a correlation coefficient (R) of -0.201 and weighted average of $80,373, a difference of 0.040%.
Median Household Income Correlation Summary
| Measurement | Trinidadian and Tobagonian | Immigrants from Trinidad and Tobago |
| Minimum | $21,629 | $21,629 |
| Maximum | $129,829 | $172,500 |
| Range | $108,200 | $150,871 |
| Mean | $79,550 | $82,579 |
| Median | $80,957 | $82,052 |
| Interquartile 25% (IQ1) | $71,474 | $70,433 |
| Interquartile 75% (IQ3) | $92,337 | $91,223 |
| Interquartile Range (IQR) | $20,862 | $20,791 |
| Standard Deviation (Sample) | $19,105 | $21,636 |
| Standard Deviation (Population) | $18,937 | $21,539 |
Demographics Similar to Trinidadians and Tobagonians and Immigrants from Trinidad and Tobago by Median Household Income
In terms of median household income, the demographic groups most similar to Trinidadians and Tobagonians are Bermudan ($80,406, a difference of 0.010%), Immigrants from the Azores ($80,357, a difference of 0.060%), Immigrants from Ecuador ($80,341, a difference of 0.080%), Immigrants from Guyana ($80,324, a difference of 0.10%), and Delaware ($80,527, a difference of 0.16%). Similarly, the demographic groups most similar to Immigrants from Trinidad and Tobago are Immigrants from the Azores ($80,357, a difference of 0.020%), Bermudan ($80,406, a difference of 0.040%), Immigrants from Ecuador ($80,341, a difference of 0.040%), Immigrants from Guyana ($80,324, a difference of 0.060%), and Delaware ($80,527, a difference of 0.19%).
| Demographics | Rating | Rank | Median Household Income |
| Immigrants | Ghana | 9.0 /100 | #221 | Tragic $81,489 |
| Immigrants | Nigeria | 7.7 /100 | #222 | Tragic $81,236 |
| Immigrants | El Salvador | 7.6 /100 | #223 | Tragic $81,213 |
| Malaysians | 7.0 /100 | #224 | Tragic $81,064 |
| Scotch-Irish | 6.6 /100 | #225 | Tragic $80,972 |
| Immigrants | Panama | 6.2 /100 | #226 | Tragic $80,873 |
| Guyanese | 5.7 /100 | #227 | Tragic $80,734 |
| Immigrants | Bangladesh | 5.7 /100 | #228 | Tragic $80,722 |
| Delaware | 5.0 /100 | #229 | Tragic $80,527 |
| Bermudans | 4.7 /100 | #230 | Tragic $80,406 |
| Trinidadians and Tobagonians | 4.7 /100 | #231 | Tragic $80,402 |
| Immigrants | Trinidad and Tobago | 4.6 /100 | #232 | Tragic $80,373 |
| Immigrants | Azores | 4.5 /100 | #233 | Tragic $80,357 |
| Immigrants | Ecuador | 4.5 /100 | #234 | Tragic $80,341 |
| Immigrants | Guyana | 4.5 /100 | #235 | Tragic $80,324 |
| Immigrants | Bosnia and Herzegovina | 3.4 /100 | #236 | Tragic $79,888 |
| Nicaraguans | 3.1 /100 | #237 | Tragic $79,737 |
| Barbadians | 3.0 /100 | #238 | Tragic $79,664 |
| Alaska Natives | 2.7 /100 | #239 | Tragic $79,509 |
| Immigrants | Western Africa | 2.7 /100 | #240 | Tragic $79,490 |
| Immigrants | Nonimmigrants | 2.6 /100 | #241 | Tragic $79,429 |