South African vs Immigrants from Trinidad and Tobago Median Household Income
COMPARE
South African
Immigrants from Trinidad and Tobago
Median Household Income
Median Household Income Comparison
South Africans
Immigrants from Trinidad and Tobago
$93,379
MEDIAN HOUSEHOLD INCOME
99.5/ 100
METRIC RATING
76th/ 347
METRIC RANK
$80,373
MEDIAN HOUSEHOLD INCOME
4.6/ 100
METRIC RATING
232nd/ 347
METRIC RANK
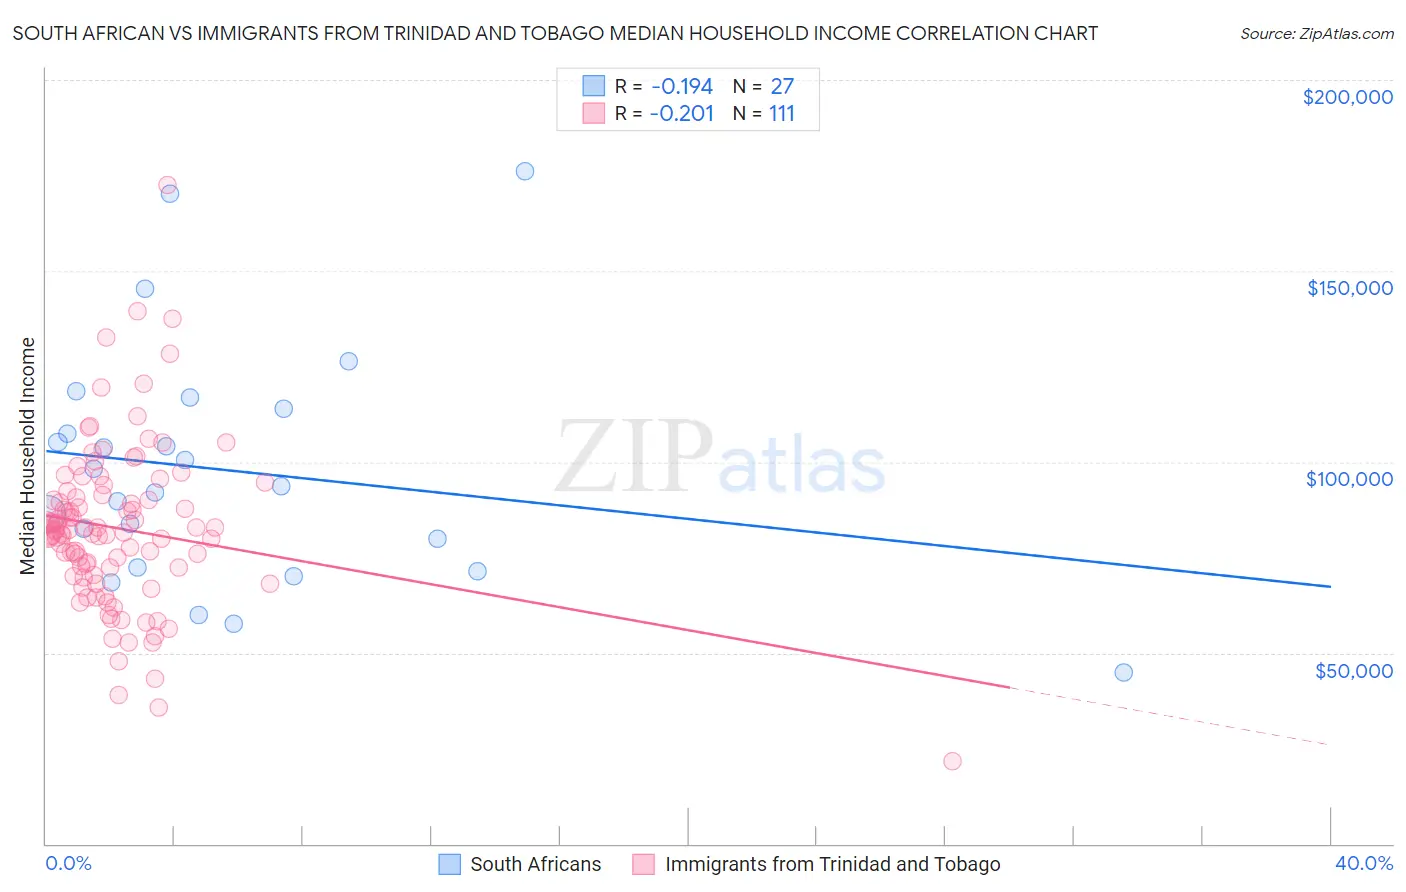
South African vs Immigrants from Trinidad and Tobago Median Household Income Correlation Chart
The statistical analysis conducted on geographies consisting of 182,537,527 people shows a poor negative correlation between the proportion of South Africans and median household income in the United States with a correlation coefficient (R) of -0.194 and weighted average of $93,379. Similarly, the statistical analysis conducted on geographies consisting of 223,468,612 people shows a weak negative correlation between the proportion of Immigrants from Trinidad and Tobago and median household income in the United States with a correlation coefficient (R) of -0.201 and weighted average of $80,373, a difference of 16.2%.
Median Household Income Correlation Summary
| Measurement | South African | Immigrants from Trinidad and Tobago |
| Minimum | $45,000 | $21,629 |
| Maximum | $176,103 | $172,500 |
| Range | $131,103 | $150,871 |
| Mean | $97,725 | $82,579 |
| Median | $93,672 | $82,052 |
| Interquartile 25% (IQ1) | $72,324 | $70,433 |
| Interquartile 75% (IQ3) | $113,958 | $91,223 |
| Interquartile Range (IQR) | $41,634 | $20,791 |
| Standard Deviation (Sample) | $31,372 | $21,636 |
| Standard Deviation (Population) | $30,786 | $21,539 |
Similar Demographics by Median Household Income
Demographics Similar to South Africans by Median Household Income
In terms of median household income, the demographic groups most similar to South Africans are Immigrants from Afghanistan ($93,375, a difference of 0.0%), Immigrants from Italy ($93,465, a difference of 0.090%), Immigrants from Latvia ($93,602, a difference of 0.24%), Immigrants from Bulgaria ($93,148, a difference of 0.25%), and Sri Lankan ($93,093, a difference of 0.31%).
| Demographics | Rating | Rank | Median Household Income |
| Argentineans | 99.7 /100 | #69 | Exceptional $93,960 |
| Immigrants | Fiji | 99.7 /100 | #70 | Exceptional $93,933 |
| Immigrants | Philippines | 99.6 /100 | #71 | Exceptional $93,899 |
| Lithuanians | 99.6 /100 | #72 | Exceptional $93,852 |
| Immigrants | Egypt | 99.6 /100 | #73 | Exceptional $93,700 |
| Immigrants | Latvia | 99.6 /100 | #74 | Exceptional $93,602 |
| Immigrants | Italy | 99.5 /100 | #75 | Exceptional $93,465 |
| South Africans | 99.5 /100 | #76 | Exceptional $93,379 |
| Immigrants | Afghanistan | 99.5 /100 | #77 | Exceptional $93,375 |
| Immigrants | Bulgaria | 99.4 /100 | #78 | Exceptional $93,148 |
| Sri Lankans | 99.4 /100 | #79 | Exceptional $93,093 |
| Tongans | 99.4 /100 | #80 | Exceptional $93,076 |
| Immigrants | Eastern Europe | 99.4 /100 | #81 | Exceptional $93,051 |
| Immigrants | Spain | 99.3 /100 | #82 | Exceptional $92,732 |
| Italians | 99.1 /100 | #83 | Exceptional $92,475 |
Demographics Similar to Immigrants from Trinidad and Tobago by Median Household Income
In terms of median household income, the demographic groups most similar to Immigrants from Trinidad and Tobago are Immigrants from the Azores ($80,357, a difference of 0.020%), Bermudan ($80,406, a difference of 0.040%), Trinidadian and Tobagonian ($80,402, a difference of 0.040%), Immigrants from Ecuador ($80,341, a difference of 0.040%), and Immigrants from Guyana ($80,324, a difference of 0.060%).
| Demographics | Rating | Rank | Median Household Income |
| Scotch-Irish | 6.6 /100 | #225 | Tragic $80,972 |
| Immigrants | Panama | 6.2 /100 | #226 | Tragic $80,873 |
| Guyanese | 5.7 /100 | #227 | Tragic $80,734 |
| Immigrants | Bangladesh | 5.7 /100 | #228 | Tragic $80,722 |
| Delaware | 5.0 /100 | #229 | Tragic $80,527 |
| Bermudans | 4.7 /100 | #230 | Tragic $80,406 |
| Trinidadians and Tobagonians | 4.7 /100 | #231 | Tragic $80,402 |
| Immigrants | Trinidad and Tobago | 4.6 /100 | #232 | Tragic $80,373 |
| Immigrants | Azores | 4.5 /100 | #233 | Tragic $80,357 |
| Immigrants | Ecuador | 4.5 /100 | #234 | Tragic $80,341 |
| Immigrants | Guyana | 4.5 /100 | #235 | Tragic $80,324 |
| Immigrants | Bosnia and Herzegovina | 3.4 /100 | #236 | Tragic $79,888 |
| Nicaraguans | 3.1 /100 | #237 | Tragic $79,737 |
| Barbadians | 3.0 /100 | #238 | Tragic $79,664 |
| Alaska Natives | 2.7 /100 | #239 | Tragic $79,509 |