Immigrants from Korea vs Immigrants from Trinidad and Tobago Median Household Income
COMPARE
Immigrants from Korea
Immigrants from Trinidad and Tobago
Median Household Income
Median Household Income Comparison
Immigrants from Korea
Immigrants from Trinidad and Tobago
$102,962
MEDIAN HOUSEHOLD INCOME
100.0/ 100
METRIC RATING
17th/ 347
METRIC RANK
$80,373
MEDIAN HOUSEHOLD INCOME
4.6/ 100
METRIC RATING
232nd/ 347
METRIC RANK
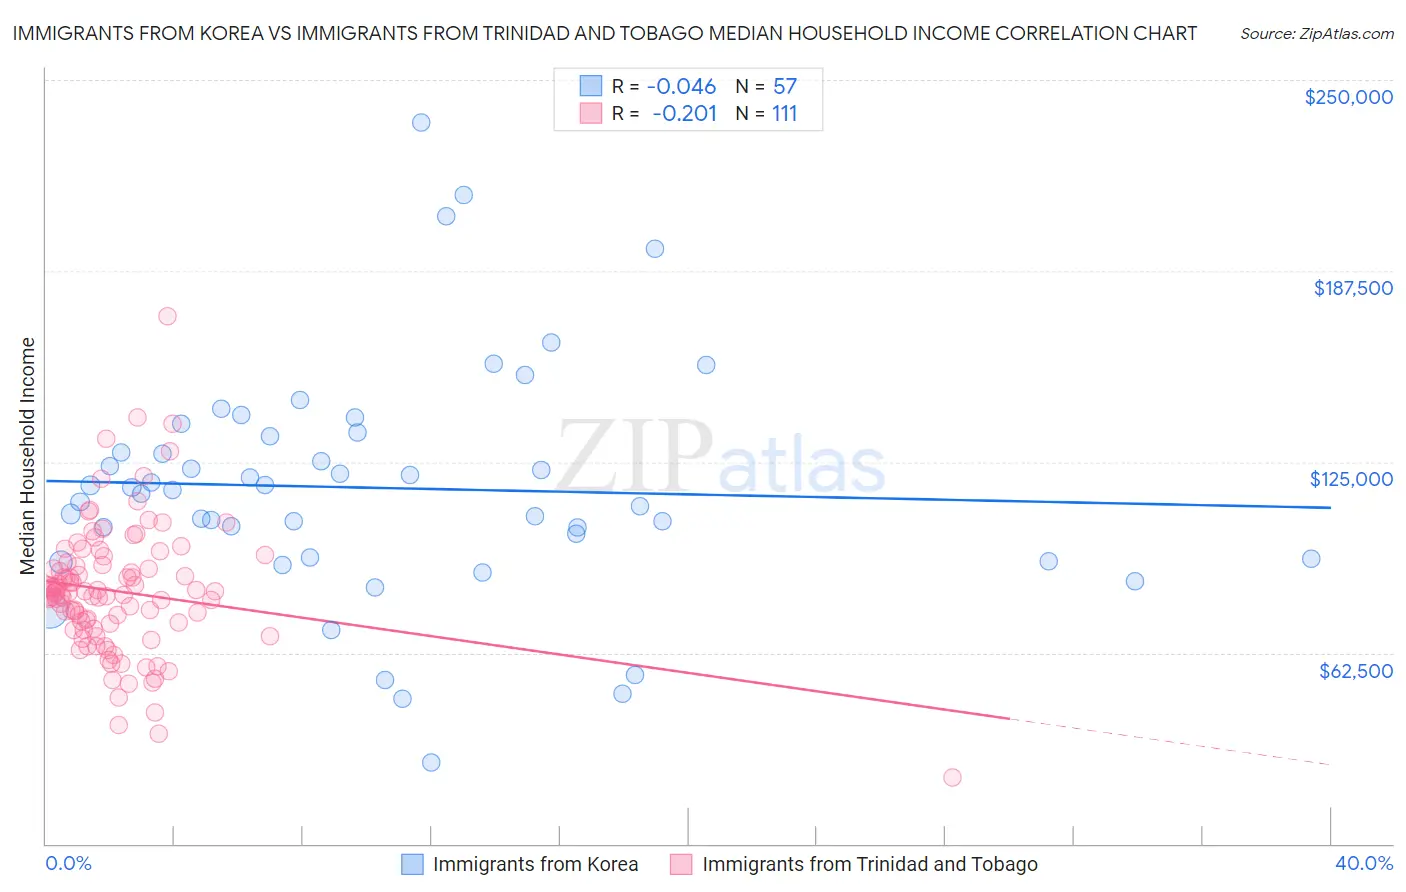
Immigrants from Korea vs Immigrants from Trinidad and Tobago Median Household Income Correlation Chart
The statistical analysis conducted on geographies consisting of 415,854,714 people shows no correlation between the proportion of Immigrants from Korea and median household income in the United States with a correlation coefficient (R) of -0.046 and weighted average of $102,962. Similarly, the statistical analysis conducted on geographies consisting of 223,468,612 people shows a weak negative correlation between the proportion of Immigrants from Trinidad and Tobago and median household income in the United States with a correlation coefficient (R) of -0.201 and weighted average of $80,373, a difference of 28.1%.
Median Household Income Correlation Summary
| Measurement | Immigrants from Korea | Immigrants from Trinidad and Tobago |
| Minimum | $26,550 | $21,629 |
| Maximum | $235,959 | $172,500 |
| Range | $209,409 | $150,871 |
| Mean | $116,491 | $82,579 |
| Median | $115,968 | $82,052 |
| Interquartile 25% (IQ1) | $93,452 | $70,433 |
| Interquartile 75% (IQ3) | $133,881 | $91,223 |
| Interquartile Range (IQR) | $40,429 | $20,791 |
| Standard Deviation (Sample) | $38,811 | $21,636 |
| Standard Deviation (Population) | $38,469 | $21,539 |
Similar Demographics by Median Household Income
Demographics Similar to Immigrants from Korea by Median Household Income
In terms of median household income, the demographic groups most similar to Immigrants from Korea are Cypriot ($102,843, a difference of 0.12%), Burmese ($103,145, a difference of 0.18%), Immigrants from Australia ($102,562, a difference of 0.39%), Bolivian ($102,195, a difference of 0.75%), and Immigrants from Israel ($104,090, a difference of 1.1%).
| Demographics | Rating | Rank | Median Household Income |
| Immigrants | South Central Asia | 100.0 /100 | #10 | Exceptional $106,057 |
| Immigrants | China | 100.0 /100 | #11 | Exceptional $105,335 |
| Indians (Asian) | 100.0 /100 | #12 | Exceptional $105,262 |
| Immigrants | Eastern Asia | 100.0 /100 | #13 | Exceptional $104,796 |
| Immigrants | Ireland | 100.0 /100 | #14 | Exceptional $104,692 |
| Immigrants | Israel | 100.0 /100 | #15 | Exceptional $104,090 |
| Burmese | 100.0 /100 | #16 | Exceptional $103,145 |
| Immigrants | Korea | 100.0 /100 | #17 | Exceptional $102,962 |
| Cypriots | 100.0 /100 | #18 | Exceptional $102,843 |
| Immigrants | Australia | 100.0 /100 | #19 | Exceptional $102,562 |
| Bolivians | 100.0 /100 | #20 | Exceptional $102,195 |
| Eastern Europeans | 100.0 /100 | #21 | Exceptional $101,781 |
| Asians | 100.0 /100 | #22 | Exceptional $101,681 |
| Immigrants | Bolivia | 100.0 /100 | #23 | Exceptional $101,394 |
| Immigrants | Japan | 100.0 /100 | #24 | Exceptional $100,711 |
Demographics Similar to Immigrants from Trinidad and Tobago by Median Household Income
In terms of median household income, the demographic groups most similar to Immigrants from Trinidad and Tobago are Immigrants from the Azores ($80,357, a difference of 0.020%), Bermudan ($80,406, a difference of 0.040%), Trinidadian and Tobagonian ($80,402, a difference of 0.040%), Immigrants from Ecuador ($80,341, a difference of 0.040%), and Immigrants from Guyana ($80,324, a difference of 0.060%).
| Demographics | Rating | Rank | Median Household Income |
| Scotch-Irish | 6.6 /100 | #225 | Tragic $80,972 |
| Immigrants | Panama | 6.2 /100 | #226 | Tragic $80,873 |
| Guyanese | 5.7 /100 | #227 | Tragic $80,734 |
| Immigrants | Bangladesh | 5.7 /100 | #228 | Tragic $80,722 |
| Delaware | 5.0 /100 | #229 | Tragic $80,527 |
| Bermudans | 4.7 /100 | #230 | Tragic $80,406 |
| Trinidadians and Tobagonians | 4.7 /100 | #231 | Tragic $80,402 |
| Immigrants | Trinidad and Tobago | 4.6 /100 | #232 | Tragic $80,373 |
| Immigrants | Azores | 4.5 /100 | #233 | Tragic $80,357 |
| Immigrants | Ecuador | 4.5 /100 | #234 | Tragic $80,341 |
| Immigrants | Guyana | 4.5 /100 | #235 | Tragic $80,324 |
| Immigrants | Bosnia and Herzegovina | 3.4 /100 | #236 | Tragic $79,888 |
| Nicaraguans | 3.1 /100 | #237 | Tragic $79,737 |
| Barbadians | 3.0 /100 | #238 | Tragic $79,664 |
| Alaska Natives | 2.7 /100 | #239 | Tragic $79,509 |