Alaska Native vs Salvadoran 11th Grade
COMPARE
Alaska Native
Salvadoran
11th Grade
11th Grade Comparison
Alaska Natives
Salvadorans
93.5%
11TH GRADE
98.4/ 100
METRIC RATING
108th/ 347
METRIC RANK
86.2%
11TH GRADE
0.0/ 100
METRIC RATING
340th/ 347
METRIC RANK
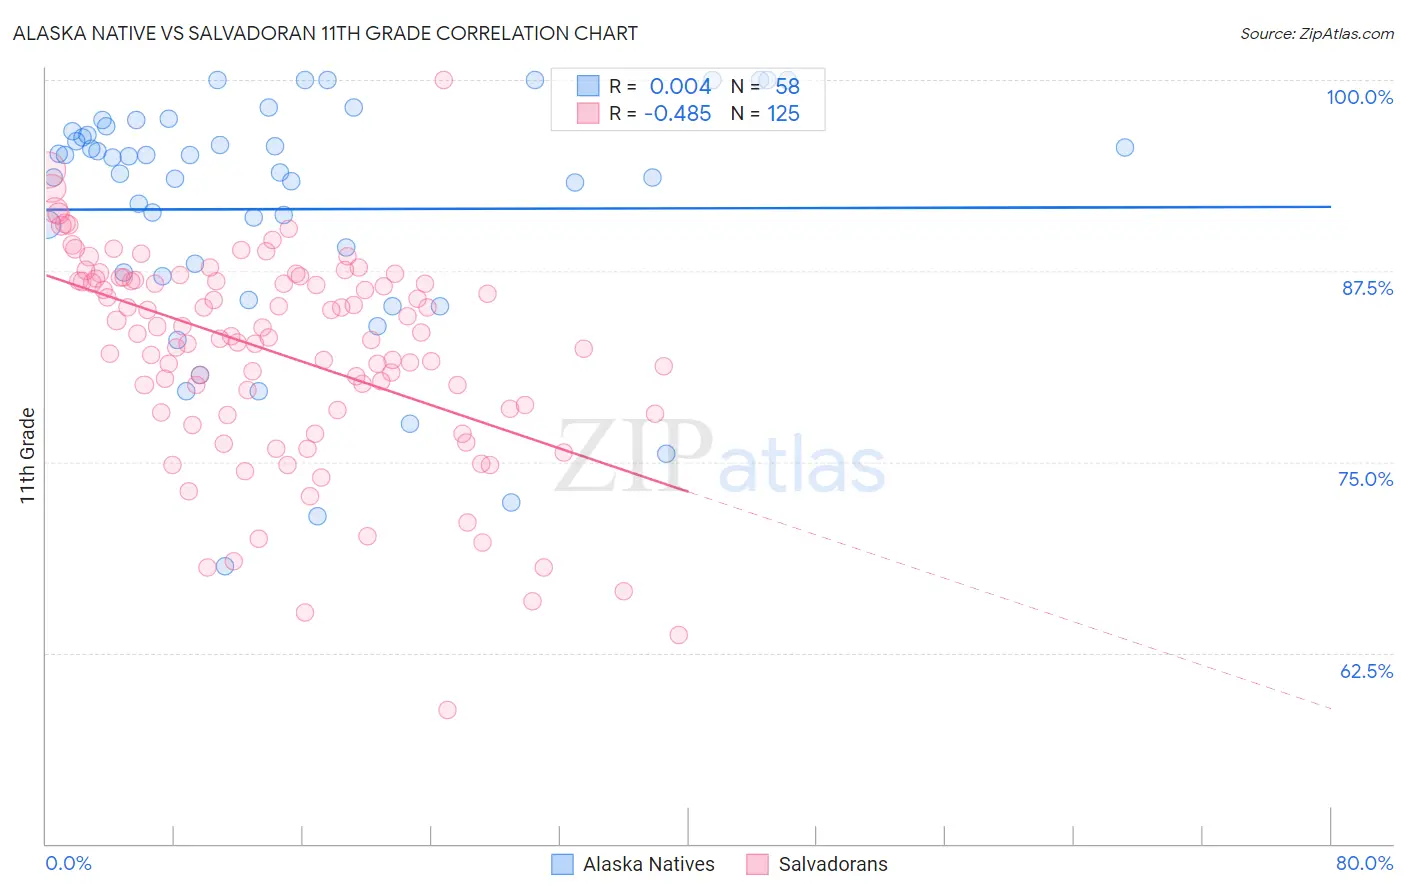
Alaska Native vs Salvadoran 11th Grade Correlation Chart
The statistical analysis conducted on geographies consisting of 76,778,827 people shows no correlation between the proportion of Alaska Natives and percentage of population with at least 11th grade education in the United States with a correlation coefficient (R) of 0.004 and weighted average of 93.5%. Similarly, the statistical analysis conducted on geographies consisting of 399,020,036 people shows a moderate negative correlation between the proportion of Salvadorans and percentage of population with at least 11th grade education in the United States with a correlation coefficient (R) of -0.485 and weighted average of 86.2%, a difference of 8.5%.
11th Grade Correlation Summary
| Measurement | Alaska Native | Salvadoran |
| Minimum | 68.2% | 58.8% |
| Maximum | 100.0% | 100.0% |
| Range | 31.8% | 41.2% |
| Mean | 91.5% | 82.1% |
| Median | 94.4% | 83.2% |
| Interquartile 25% (IQ1) | 87.4% | 78.3% |
| Interquartile 75% (IQ3) | 96.6% | 86.9% |
| Interquartile Range (IQR) | 9.3% | 8.6% |
| Standard Deviation (Sample) | 7.9% | 6.9% |
| Standard Deviation (Population) | 7.8% | 6.9% |
Similar Demographics by 11th Grade
Demographics Similar to Alaska Natives by 11th Grade
In terms of 11th grade, the demographic groups most similar to Alaska Natives are Immigrants from Norway (93.5%, a difference of 0.0%), Immigrants from Kuwait (93.5%, a difference of 0.0%), Syrian (93.4%, a difference of 0.010%), Immigrants from Europe (93.5%, a difference of 0.020%), and Immigrants from Serbia (93.5%, a difference of 0.020%).
| Demographics | Rating | Rank | 11th Grade |
| Immigrants | Romania | 98.7 /100 | #101 | Exceptional 93.5% |
| Chippewa | 98.6 /100 | #102 | Exceptional 93.5% |
| Lebanese | 98.6 /100 | #103 | Exceptional 93.5% |
| Immigrants | Europe | 98.6 /100 | #104 | Exceptional 93.5% |
| Immigrants | Serbia | 98.6 /100 | #105 | Exceptional 93.5% |
| Immigrants | Croatia | 98.6 /100 | #106 | Exceptional 93.5% |
| Immigrants | Norway | 98.4 /100 | #107 | Exceptional 93.5% |
| Alaska Natives | 98.4 /100 | #108 | Exceptional 93.5% |
| Immigrants | Kuwait | 98.4 /100 | #109 | Exceptional 93.5% |
| Syrians | 98.4 /100 | #110 | Exceptional 93.4% |
| Yugoslavians | 98.1 /100 | #111 | Exceptional 93.4% |
| Immigrants | Germany | 98.0 /100 | #112 | Exceptional 93.4% |
| Immigrants | Zimbabwe | 97.8 /100 | #113 | Exceptional 93.4% |
| Jordanians | 97.8 /100 | #114 | Exceptional 93.4% |
| Palestinians | 97.7 /100 | #115 | Exceptional 93.4% |
Demographics Similar to Salvadorans by 11th Grade
In terms of 11th grade, the demographic groups most similar to Salvadorans are Mexican (86.1%, a difference of 0.060%), Guatemalan (86.4%, a difference of 0.23%), Immigrants from Guatemala (85.8%, a difference of 0.39%), Immigrants from Latin America (86.8%, a difference of 0.73%), and Immigrants from Dominican Republic (86.9%, a difference of 0.85%).
| Demographics | Rating | Rank | 11th Grade |
| Immigrants | Yemen | 0.0 /100 | #333 | Tragic 87.1% |
| Houma | 0.0 /100 | #334 | Tragic 87.0% |
| Central Americans | 0.0 /100 | #335 | Tragic 86.9% |
| Immigrants | Dominican Republic | 0.0 /100 | #336 | Tragic 86.9% |
| Immigrants | Honduras | 0.0 /100 | #337 | Tragic 86.9% |
| Immigrants | Latin America | 0.0 /100 | #338 | Tragic 86.8% |
| Guatemalans | 0.0 /100 | #339 | Tragic 86.4% |
| Salvadorans | 0.0 /100 | #340 | Tragic 86.2% |
| Mexicans | 0.0 /100 | #341 | Tragic 86.1% |
| Immigrants | Guatemala | 0.0 /100 | #342 | Tragic 85.8% |
| Immigrants | El Salvador | 0.0 /100 | #343 | Tragic 85.3% |
| Yakama | 0.0 /100 | #344 | Tragic 85.0% |
| Immigrants | Central America | 0.0 /100 | #345 | Tragic 84.9% |
| Spanish American Indians | 0.0 /100 | #346 | Tragic 84.7% |
| Immigrants | Mexico | 0.0 /100 | #347 | Tragic 84.5% |