Alaska Native vs Salvadoran Unemployment Among Ages 35 to 44 years
COMPARE
Alaska Native
Salvadoran
Unemployment Among Ages 35 to 44 years
Unemployment Among Ages 35 to 44 years Comparison
Alaska Natives
Salvadorans
6.6%
UNEMPLOYMENT AMONG AGES 35 TO 44 YEARS
0.0/ 100
METRIC RATING
326th/ 347
METRIC RANK
5.1%
UNEMPLOYMENT AMONG AGES 35 TO 44 YEARS
0.4/ 100
METRIC RATING
243rd/ 347
METRIC RANK
Alaska Native vs Salvadoran Unemployment Among Ages 35 to 44 years Correlation Chart
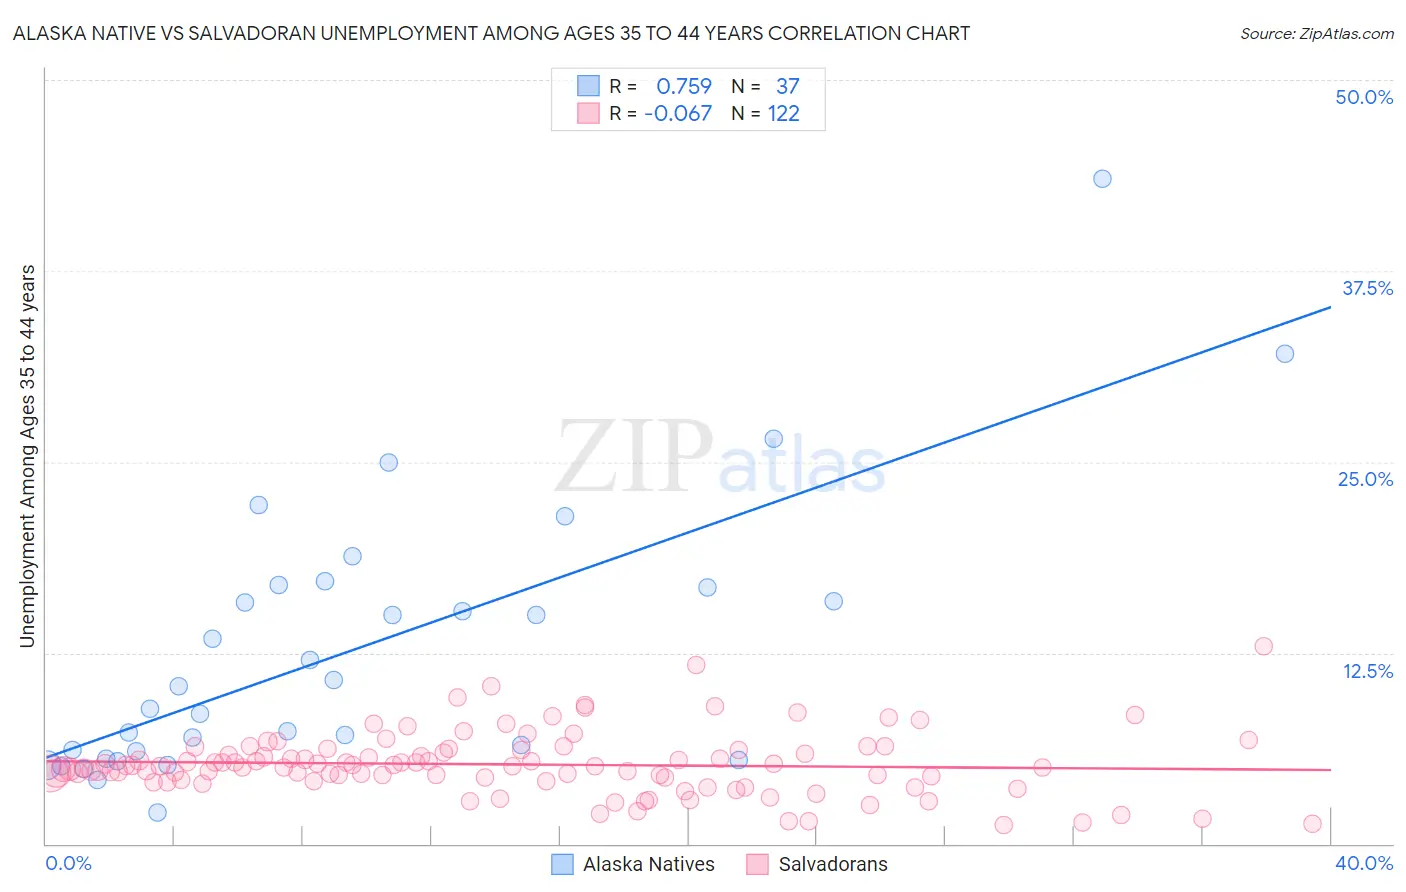
The statistical analysis conducted on geographies consisting of 76,108,563 people shows a strong positive correlation between the proportion of Alaska Natives and unemployment rate among population between the ages 35 and 44 in the United States with a correlation coefficient (R) of 0.759 and weighted average of 6.6%. Similarly, the statistical analysis conducted on geographies consisting of 391,087,109 people shows a slight negative correlation between the proportion of Salvadorans and unemployment rate among population between the ages 35 and 44 in the United States with a correlation coefficient (R) of -0.067 and weighted average of 5.1%, a difference of 27.6%.
Unemployment Among Ages 35 to 44 years Correlation Summary
| Measurement | Alaska Native | Salvadoran |
| Minimum | 2.0% | 1.2% |
| Maximum | 43.5% | 12.9% |
| Range | 41.5% | 11.7% |
| Mean | 12.7% | 5.2% |
| Median | 10.3% | 5.1% |
| Interquartile 25% (IQ1) | 5.8% | 4.2% |
| Interquartile 75% (IQ3) | 16.9% | 6.1% |
| Interquartile Range (IQR) | 11.0% | 1.9% |
| Standard Deviation (Sample) | 8.9% | 2.0% |
| Standard Deviation (Population) | 8.7% | 2.0% |
Similar Demographics by Unemployment Among Ages 35 to 44 years
Demographics Similar to Alaska Natives by Unemployment Among Ages 35 to 44 years
In terms of unemployment among ages 35 to 44 years, the demographic groups most similar to Alaska Natives are Cape Verdean (6.6%, a difference of 0.050%), Immigrants from Yemen (6.6%, a difference of 0.070%), Menominee (6.5%, a difference of 0.43%), Shoshone (6.6%, a difference of 0.74%), and Dominican (6.4%, a difference of 2.0%).
| Demographics | Rating | Rank | Unemployment Among Ages 35 to 44 years |
| Immigrants | Grenada | 0.0 /100 | #319 | Tragic 6.2% |
| Immigrants | Armenia | 0.0 /100 | #320 | Tragic 6.2% |
| Chippewa | 0.0 /100 | #321 | Tragic 6.2% |
| Immigrants | Dominican Republic | 0.0 /100 | #322 | Tragic 6.4% |
| Dominicans | 0.0 /100 | #323 | Tragic 6.4% |
| Menominee | 0.0 /100 | #324 | Tragic 6.5% |
| Immigrants | Yemen | 0.0 /100 | #325 | Tragic 6.6% |
| Alaska Natives | 0.0 /100 | #326 | Tragic 6.6% |
| Cape Verdeans | 0.0 /100 | #327 | Tragic 6.6% |
| Shoshone | 0.0 /100 | #328 | Tragic 6.6% |
| Paiute | 0.0 /100 | #329 | Tragic 6.9% |
| Immigrants | Cabo Verde | 0.0 /100 | #330 | Tragic 6.9% |
| Pueblo | 0.0 /100 | #331 | Tragic 7.1% |
| Natives/Alaskans | 0.0 /100 | #332 | Tragic 7.3% |
| Puerto Ricans | 0.0 /100 | #333 | Tragic 7.6% |
Demographics Similar to Salvadorans by Unemployment Among Ages 35 to 44 years
In terms of unemployment among ages 35 to 44 years, the demographic groups most similar to Salvadorans are Guatemalan (5.1%, a difference of 0.0%), Delaware (5.1%, a difference of 0.12%), Bahamian (5.2%, a difference of 0.26%), Immigrants from Guatemala (5.2%, a difference of 0.26%), and Immigrants from Somalia (5.2%, a difference of 0.42%).
| Demographics | Rating | Rank | Unemployment Among Ages 35 to 44 years |
| Central Americans | 0.8 /100 | #236 | Tragic 5.1% |
| Kiowa | 0.8 /100 | #237 | Tragic 5.1% |
| Hondurans | 0.7 /100 | #238 | Tragic 5.1% |
| Nigerians | 0.7 /100 | #239 | Tragic 5.1% |
| Somalis | 0.7 /100 | #240 | Tragic 5.1% |
| Immigrants | Honduras | 0.6 /100 | #241 | Tragic 5.1% |
| Delaware | 0.5 /100 | #242 | Tragic 5.1% |
| Salvadorans | 0.4 /100 | #243 | Tragic 5.1% |
| Guatemalans | 0.4 /100 | #244 | Tragic 5.1% |
| Bahamians | 0.4 /100 | #245 | Tragic 5.2% |
| Immigrants | Guatemala | 0.4 /100 | #246 | Tragic 5.2% |
| Immigrants | Somalia | 0.3 /100 | #247 | Tragic 5.2% |
| Alsatians | 0.2 /100 | #248 | Tragic 5.2% |
| Immigrants | Liberia | 0.2 /100 | #249 | Tragic 5.2% |
| Immigrants | El Salvador | 0.2 /100 | #250 | Tragic 5.2% |