Immigrants vs Turkish Median Household Income
COMPARE
Immigrants
Turkish
Median Household Income
Median Household Income Comparison
Immigrants
Turks
$85,818
MEDIAN HOUSEHOLD INCOME
61.3/ 100
METRIC RATING
167th/ 347
METRIC RANK
$99,389
MEDIAN HOUSEHOLD INCOME
100.0/ 100
METRIC RATING
31st/ 347
METRIC RANK
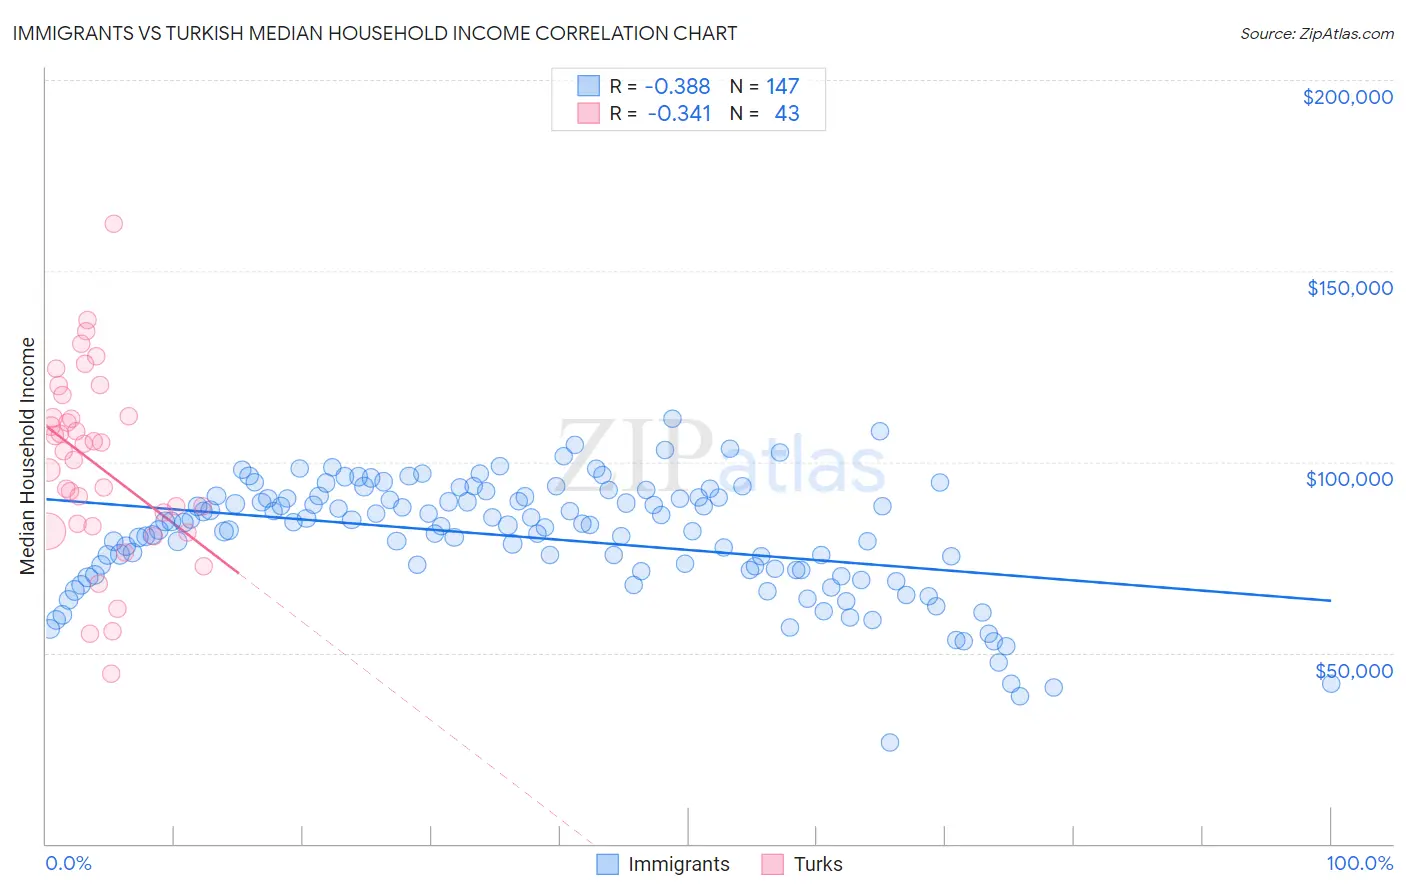
Immigrants vs Turkish Median Household Income Correlation Chart
The statistical analysis conducted on geographies consisting of 575,988,831 people shows a mild negative correlation between the proportion of Immigrants and median household income in the United States with a correlation coefficient (R) of -0.388 and weighted average of $85,818. Similarly, the statistical analysis conducted on geographies consisting of 271,658,597 people shows a mild negative correlation between the proportion of Turks and median household income in the United States with a correlation coefficient (R) of -0.341 and weighted average of $99,389, a difference of 15.8%.
Median Household Income Correlation Summary
| Measurement | Immigrants | Turkish |
| Minimum | $26,558 | $44,531 |
| Maximum | $111,218 | $162,391 |
| Range | $84,660 | $117,860 |
| Mean | $80,268 | $99,338 |
| Median | $83,546 | $102,665 |
| Interquartile 25% (IQ1) | $71,664 | $83,043 |
| Interquartile 75% (IQ3) | $90,776 | $112,097 |
| Interquartile Range (IQR) | $19,112 | $29,054 |
| Standard Deviation (Sample) | $15,311 | $24,163 |
| Standard Deviation (Population) | $15,259 | $23,880 |
Similar Demographics by Median Household Income
Demographics Similar to Immigrants by Median Household Income
In terms of median household income, the demographic groups most similar to Immigrants are Icelander ($85,797, a difference of 0.020%), Colombian ($85,716, a difference of 0.12%), Swiss ($85,681, a difference of 0.16%), Immigrants from South America ($85,611, a difference of 0.24%), and Scandinavian ($86,073, a difference of 0.30%).
| Demographics | Rating | Rank | Median Household Income |
| Luxembourgers | 70.0 /100 | #160 | Good $86,418 |
| Slavs | 69.7 /100 | #161 | Good $86,398 |
| Guamanians/Chamorros | 67.7 /100 | #162 | Good $86,255 |
| Czechs | 66.4 /100 | #163 | Good $86,164 |
| Irish | 66.2 /100 | #164 | Good $86,145 |
| Norwegians | 65.3 /100 | #165 | Good $86,084 |
| Scandinavians | 65.1 /100 | #166 | Good $86,073 |
| Immigrants | Immigrants | 61.3 /100 | #167 | Good $85,818 |
| Icelanders | 61.0 /100 | #168 | Good $85,797 |
| Colombians | 59.7 /100 | #169 | Average $85,716 |
| Swiss | 59.2 /100 | #170 | Average $85,681 |
| Immigrants | South America | 58.1 /100 | #171 | Average $85,611 |
| Slovenes | 57.4 /100 | #172 | Average $85,562 |
| Immigrants | Cameroon | 53.4 /100 | #173 | Average $85,314 |
| Scottish | 50.0 /100 | #174 | Average $85,101 |
Demographics Similar to Turks by Median Household Income
In terms of median household income, the demographic groups most similar to Turks are Immigrants from Northern Europe ($99,813, a difference of 0.43%), Immigrants from Asia ($99,933, a difference of 0.55%), Immigrants from Sri Lanka ($99,943, a difference of 0.56%), Bhutanese ($100,151, a difference of 0.77%), and Immigrants from Denmark ($98,510, a difference of 0.89%).
| Demographics | Rating | Rank | Median Household Income |
| Immigrants | Japan | 100.0 /100 | #24 | Exceptional $100,711 |
| Immigrants | Sweden | 100.0 /100 | #25 | Exceptional $100,699 |
| Immigrants | Belgium | 100.0 /100 | #26 | Exceptional $100,306 |
| Bhutanese | 100.0 /100 | #27 | Exceptional $100,151 |
| Immigrants | Sri Lanka | 100.0 /100 | #28 | Exceptional $99,943 |
| Immigrants | Asia | 100.0 /100 | #29 | Exceptional $99,933 |
| Immigrants | Northern Europe | 100.0 /100 | #30 | Exceptional $99,813 |
| Turks | 100.0 /100 | #31 | Exceptional $99,389 |
| Immigrants | Denmark | 100.0 /100 | #32 | Exceptional $98,510 |
| Chinese | 100.0 /100 | #33 | Exceptional $98,496 |
| Russians | 100.0 /100 | #34 | Exceptional $98,008 |
| Immigrants | Switzerland | 100.0 /100 | #35 | Exceptional $97,979 |
| Immigrants | Pakistan | 100.0 /100 | #36 | Exceptional $97,528 |
| Latvians | 100.0 /100 | #37 | Exceptional $97,311 |
| Immigrants | Indonesia | 100.0 /100 | #38 | Exceptional $97,297 |