Okinawan vs Sierra Leonean Householder Income Over 65 years
COMPARE
Okinawan
Sierra Leonean
Householder Income Over 65 years
Householder Income Over 65 years Comparison
Okinawans
Sierra Leoneans
$70,846
HOUSEHOLDER INCOME OVER 65 YEARS
100.0/ 100
METRIC RATING
16th/ 347
METRIC RANK
$65,038
HOUSEHOLDER INCOME OVER 65 YEARS
98.6/ 100
METRIC RATING
75th/ 347
METRIC RANK
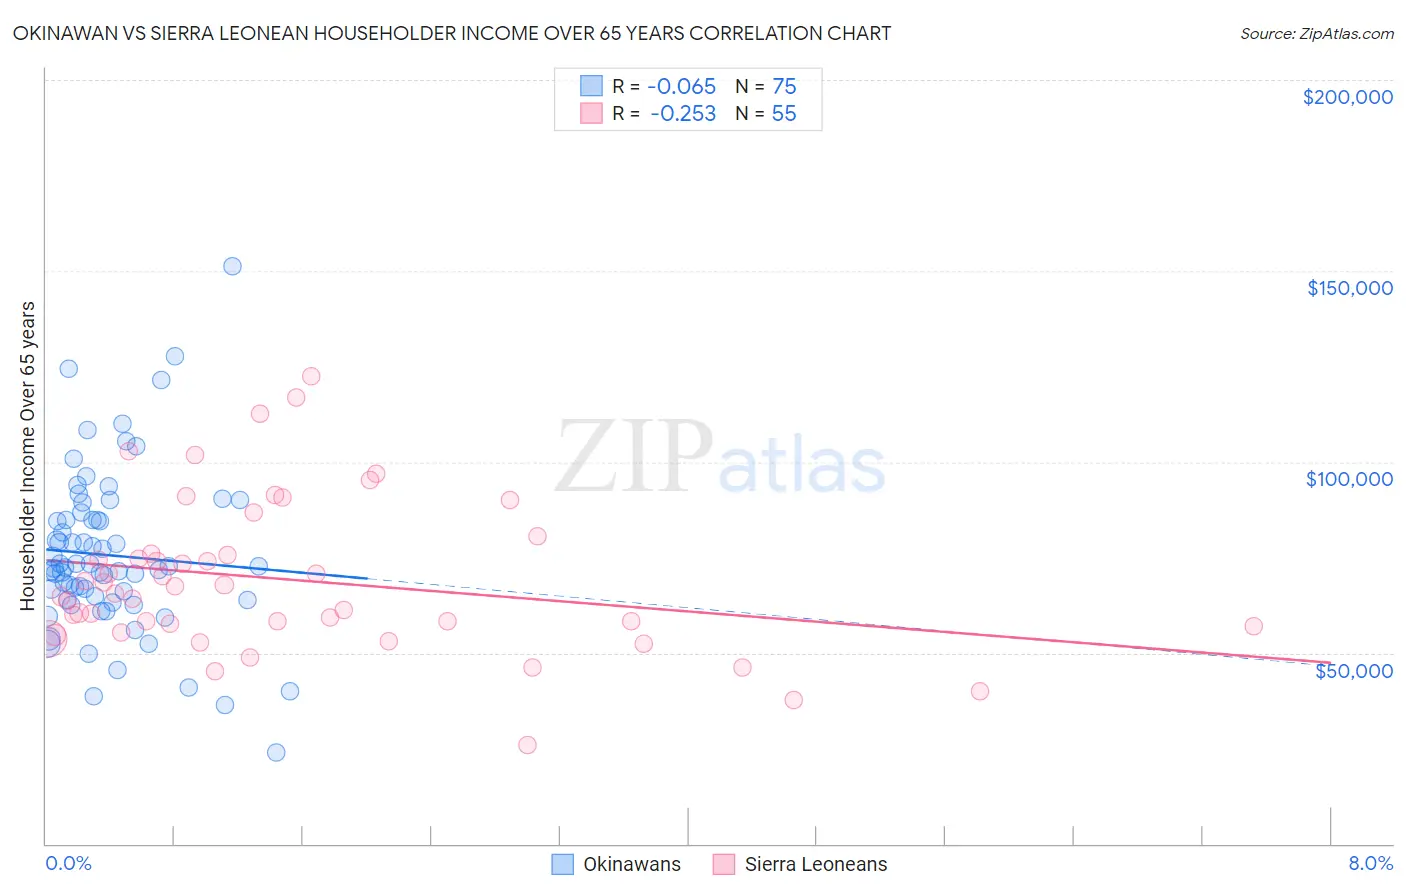
Okinawan vs Sierra Leonean Householder Income Over 65 years Correlation Chart
The statistical analysis conducted on geographies consisting of 73,674,458 people shows a slight negative correlation between the proportion of Okinawans and household income with householder over the age of 65 in the United States with a correlation coefficient (R) of -0.065 and weighted average of $70,846. Similarly, the statistical analysis conducted on geographies consisting of 83,245,915 people shows a weak negative correlation between the proportion of Sierra Leoneans and household income with householder over the age of 65 in the United States with a correlation coefficient (R) of -0.253 and weighted average of $65,038, a difference of 8.9%.
Householder Income Over 65 years Correlation Summary
| Measurement | Okinawan | Sierra Leonean |
| Minimum | $24,013 | $25,884 |
| Maximum | $151,316 | $122,529 |
| Range | $127,303 | $96,645 |
| Mean | $75,534 | $69,137 |
| Median | $72,378 | $65,524 |
| Interquartile 25% (IQ1) | $63,808 | $56,799 |
| Interquartile 75% (IQ3) | $84,880 | $75,960 |
| Interquartile Range (IQR) | $21,072 | $19,161 |
| Standard Deviation (Sample) | $21,585 | $20,039 |
| Standard Deviation (Population) | $21,441 | $19,856 |
Similar Demographics by Householder Income Over 65 years
Demographics Similar to Okinawans by Householder Income Over 65 years
In terms of householder income over 65 years, the demographic groups most similar to Okinawans are Immigrants from Korea ($70,696, a difference of 0.21%), Native Hawaiian ($71,021, a difference of 0.25%), Burmese ($71,139, a difference of 0.41%), Eastern European ($70,470, a difference of 0.53%), and Indian (Asian) ($70,238, a difference of 0.87%).
| Demographics | Rating | Rank | Householder Income Over 65 years |
| Immigrants | India | 100.0 /100 | #9 | Exceptional $72,804 |
| Bhutanese | 100.0 /100 | #10 | Exceptional $72,288 |
| Thais | 100.0 /100 | #11 | Exceptional $72,099 |
| Cypriots | 100.0 /100 | #12 | Exceptional $71,714 |
| Immigrants | Hong Kong | 100.0 /100 | #13 | Exceptional $71,567 |
| Burmese | 100.0 /100 | #14 | Exceptional $71,139 |
| Native Hawaiians | 100.0 /100 | #15 | Exceptional $71,021 |
| Okinawans | 100.0 /100 | #16 | Exceptional $70,846 |
| Immigrants | Korea | 100.0 /100 | #17 | Exceptional $70,696 |
| Eastern Europeans | 100.0 /100 | #18 | Exceptional $70,470 |
| Indians (Asian) | 100.0 /100 | #19 | Exceptional $70,238 |
| Immigrants | South Central Asia | 100.0 /100 | #20 | Exceptional $70,103 |
| Immigrants | Eastern Asia | 100.0 /100 | #21 | Exceptional $69,872 |
| Immigrants | Israel | 100.0 /100 | #22 | Exceptional $69,857 |
| Immigrants | Japan | 100.0 /100 | #23 | Exceptional $69,774 |
Demographics Similar to Sierra Leoneans by Householder Income Over 65 years
In terms of householder income over 65 years, the demographic groups most similar to Sierra Leoneans are Ethiopian ($64,989, a difference of 0.080%), Immigrants from Canada ($64,952, a difference of 0.13%), Immigrants from Western Europe ($64,933, a difference of 0.16%), Hawaiian ($64,920, a difference of 0.18%), and Lithuanian ($65,209, a difference of 0.26%).
| Demographics | Rating | Rank | Householder Income Over 65 years |
| Egyptians | 99.1 /100 | #68 | Exceptional $65,441 |
| Samoans | 99.1 /100 | #69 | Exceptional $65,427 |
| Mongolians | 99.0 /100 | #70 | Exceptional $65,326 |
| Greeks | 98.9 /100 | #71 | Exceptional $65,306 |
| Argentineans | 98.9 /100 | #72 | Exceptional $65,246 |
| Immigrants | Ethiopia | 98.9 /100 | #73 | Exceptional $65,238 |
| Lithuanians | 98.8 /100 | #74 | Exceptional $65,209 |
| Sierra Leoneans | 98.6 /100 | #75 | Exceptional $65,038 |
| Ethiopians | 98.5 /100 | #76 | Exceptional $64,989 |
| Immigrants | Canada | 98.5 /100 | #77 | Exceptional $64,952 |
| Immigrants | Western Europe | 98.5 /100 | #78 | Exceptional $64,933 |
| Hawaiians | 98.4 /100 | #79 | Exceptional $64,920 |
| Immigrants | North America | 98.3 /100 | #80 | Exceptional $64,856 |
| Immigrants | Europe | 98.3 /100 | #81 | Exceptional $64,828 |
| Immigrants | Fiji | 98.2 /100 | #82 | Exceptional $64,795 |