African vs Immigrants from Nicaragua Per Capita Income
COMPARE
African
Immigrants from Nicaragua
Per Capita Income
Per Capita Income Comparison
Africans
Immigrants from Nicaragua
$37,785
PER CAPITA INCOME
0.1/ 100
METRIC RATING
284th/ 347
METRIC RANK
$38,065
PER CAPITA INCOME
0.2/ 100
METRIC RATING
278th/ 347
METRIC RANK
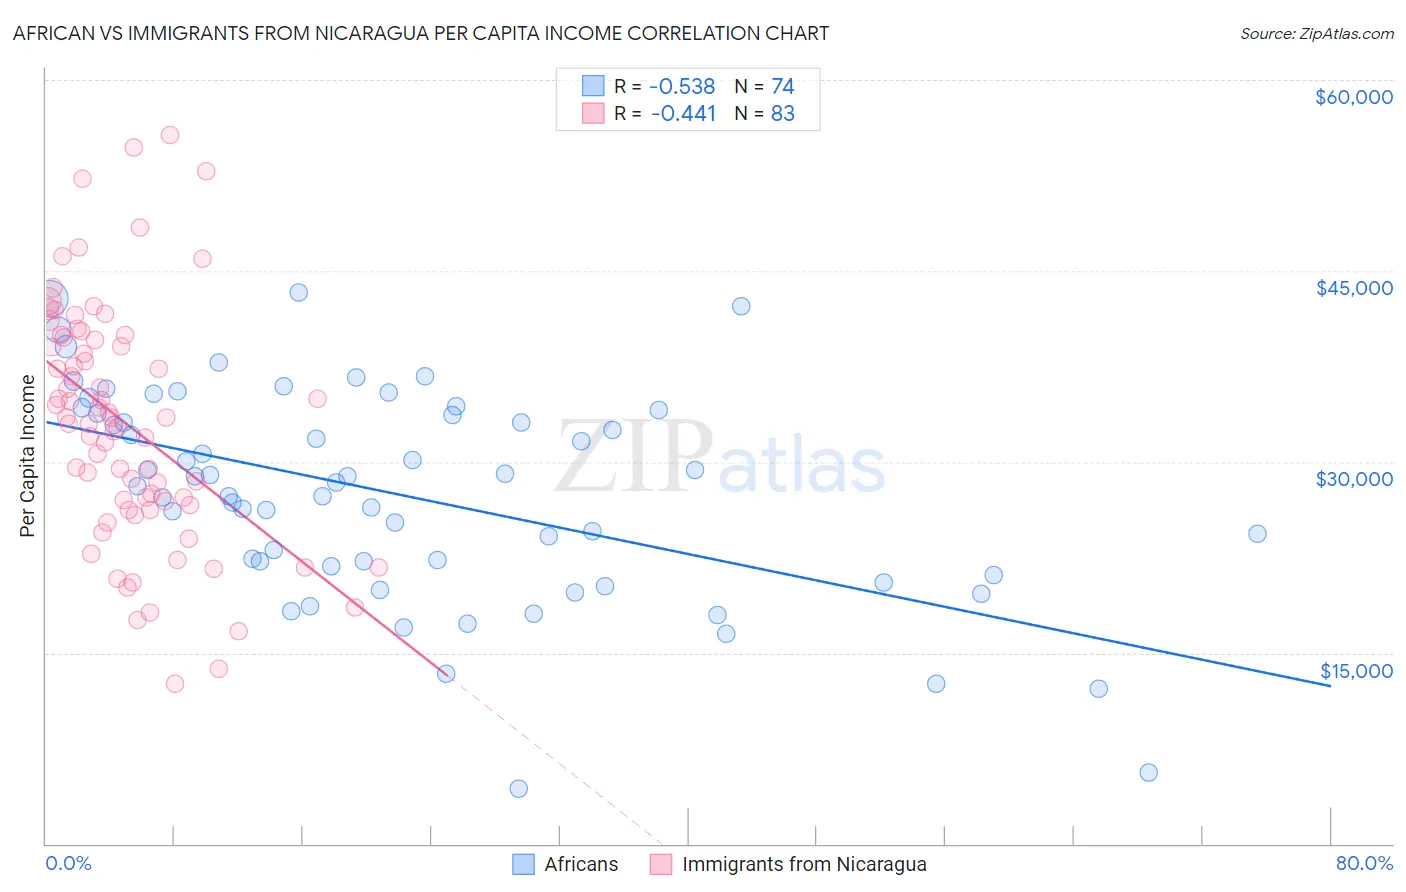
African vs Immigrants from Nicaragua Per Capita Income Correlation Chart
The statistical analysis conducted on geographies consisting of 470,145,104 people shows a substantial negative correlation between the proportion of Africans and per capita income in the United States with a correlation coefficient (R) of -0.538 and weighted average of $37,785. Similarly, the statistical analysis conducted on geographies consisting of 236,340,517 people shows a moderate negative correlation between the proportion of Immigrants from Nicaragua and per capita income in the United States with a correlation coefficient (R) of -0.441 and weighted average of $38,065, a difference of 0.74%.
Per Capita Income Correlation Summary
| Measurement | African | Immigrants from Nicaragua |
| Minimum | $4,302 | $12,549 |
| Maximum | $43,354 | $55,632 |
| Range | $39,052 | $43,083 |
| Mean | $27,384 | $33,018 |
| Median | $28,229 | $33,470 |
| Interquartile 25% (IQ1) | $21,779 | $26,578 |
| Interquartile 75% (IQ3) | $33,791 | $39,762 |
| Interquartile Range (IQR) | $12,012 | $13,184 |
| Standard Deviation (Sample) | $8,322 | $9,366 |
| Standard Deviation (Population) | $8,265 | $9,309 |
Demographics Similar to Africans and Immigrants from Nicaragua by Per Capita Income
In terms of per capita income, the demographic groups most similar to Africans are Guatemalan ($37,766, a difference of 0.050%), Pennsylvania German ($37,842, a difference of 0.15%), Immigrants from Laos ($37,857, a difference of 0.19%), Central American Indian ($37,699, a difference of 0.23%), and Dominican ($37,697, a difference of 0.24%). Similarly, the demographic groups most similar to Immigrants from Nicaragua are Colville ($38,047, a difference of 0.050%), Potawatomi ($38,046, a difference of 0.050%), Comanche ($38,088, a difference of 0.060%), Hmong ($38,120, a difference of 0.15%), and Immigrants from Liberia ($38,165, a difference of 0.26%).
| Demographics | Rating | Rank | Per Capita Income |
| Central Americans | 0.3 /100 | #271 | Tragic $38,560 |
| Immigrants | Cabo Verde | 0.3 /100 | #272 | Tragic $38,540 |
| Nepalese | 0.3 /100 | #273 | Tragic $38,442 |
| Immigrants | El Salvador | 0.3 /100 | #274 | Tragic $38,394 |
| Immigrants | Liberia | 0.2 /100 | #275 | Tragic $38,165 |
| Hmong | 0.2 /100 | #276 | Tragic $38,120 |
| Comanche | 0.2 /100 | #277 | Tragic $38,088 |
| Immigrants | Nicaragua | 0.2 /100 | #278 | Tragic $38,065 |
| Colville | 0.2 /100 | #279 | Tragic $38,047 |
| Potawatomi | 0.2 /100 | #280 | Tragic $38,046 |
| Immigrants | Dominica | 0.2 /100 | #281 | Tragic $37,952 |
| Immigrants | Laos | 0.1 /100 | #282 | Tragic $37,857 |
| Pennsylvania Germans | 0.1 /100 | #283 | Tragic $37,842 |
| Africans | 0.1 /100 | #284 | Tragic $37,785 |
| Guatemalans | 0.1 /100 | #285 | Tragic $37,766 |
| Central American Indians | 0.1 /100 | #286 | Tragic $37,699 |
| Dominicans | 0.1 /100 | #287 | Tragic $37,697 |
| Blackfeet | 0.1 /100 | #288 | Tragic $37,695 |
| U.S. Virgin Islanders | 0.1 /100 | #289 | Tragic $37,589 |
| Immigrants | Guatemala | 0.1 /100 | #290 | Tragic $37,550 |
| Cajuns | 0.1 /100 | #291 | Tragic $37,527 |