African vs Immigrants from Cuba Per Capita Income
COMPARE
African
Immigrants from Cuba
Per Capita Income
Per Capita Income Comparison
Africans
Immigrants from Cuba
$37,785
PER CAPITA INCOME
0.1/ 100
METRIC RATING
284th/ 347
METRIC RANK
$34,910
PER CAPITA INCOME
0.0/ 100
METRIC RATING
326th/ 347
METRIC RANK
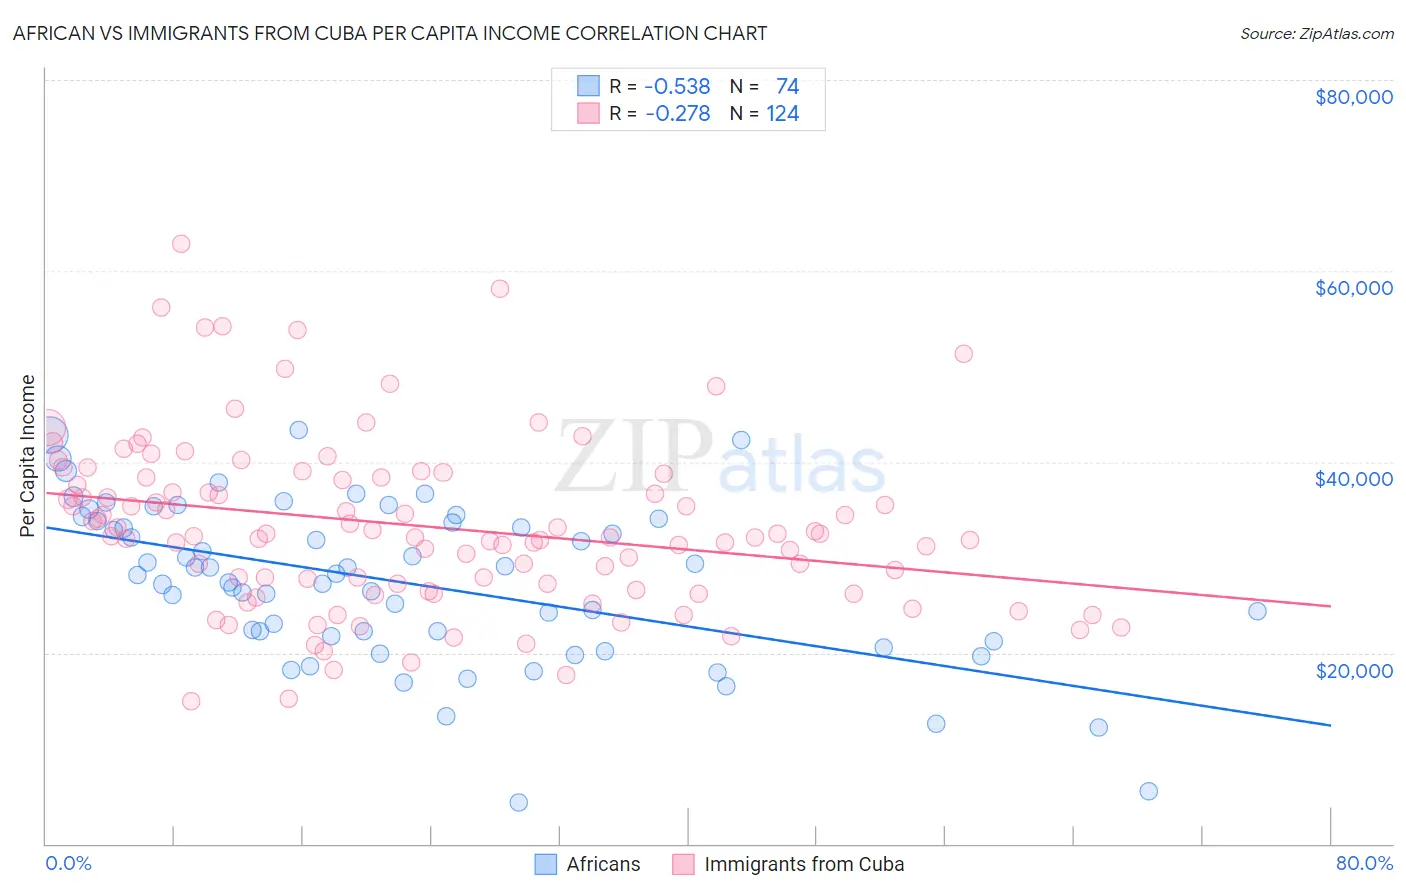
African vs Immigrants from Cuba Per Capita Income Correlation Chart
The statistical analysis conducted on geographies consisting of 470,145,104 people shows a substantial negative correlation between the proportion of Africans and per capita income in the United States with a correlation coefficient (R) of -0.538 and weighted average of $37,785. Similarly, the statistical analysis conducted on geographies consisting of 325,884,272 people shows a weak negative correlation between the proportion of Immigrants from Cuba and per capita income in the United States with a correlation coefficient (R) of -0.278 and weighted average of $34,910, a difference of 8.2%.
Per Capita Income Correlation Summary
| Measurement | African | Immigrants from Cuba |
| Minimum | $4,302 | $14,936 |
| Maximum | $43,354 | $62,804 |
| Range | $39,052 | $47,868 |
| Mean | $27,384 | $33,273 |
| Median | $28,229 | $32,226 |
| Interquartile 25% (IQ1) | $21,779 | $26,888 |
| Interquartile 75% (IQ3) | $33,791 | $38,343 |
| Interquartile Range (IQR) | $12,012 | $11,455 |
| Standard Deviation (Sample) | $8,322 | $9,025 |
| Standard Deviation (Population) | $8,265 | $8,989 |
Similar Demographics by Per Capita Income
Demographics Similar to Africans by Per Capita Income
In terms of per capita income, the demographic groups most similar to Africans are Guatemalan ($37,766, a difference of 0.050%), Pennsylvania German ($37,842, a difference of 0.15%), Immigrants from Laos ($37,857, a difference of 0.19%), Central American Indian ($37,699, a difference of 0.23%), and Dominican ($37,697, a difference of 0.24%).
| Demographics | Rating | Rank | Per Capita Income |
| Comanche | 0.2 /100 | #277 | Tragic $38,088 |
| Immigrants | Nicaragua | 0.2 /100 | #278 | Tragic $38,065 |
| Colville | 0.2 /100 | #279 | Tragic $38,047 |
| Potawatomi | 0.2 /100 | #280 | Tragic $38,046 |
| Immigrants | Dominica | 0.2 /100 | #281 | Tragic $37,952 |
| Immigrants | Laos | 0.1 /100 | #282 | Tragic $37,857 |
| Pennsylvania Germans | 0.1 /100 | #283 | Tragic $37,842 |
| Africans | 0.1 /100 | #284 | Tragic $37,785 |
| Guatemalans | 0.1 /100 | #285 | Tragic $37,766 |
| Central American Indians | 0.1 /100 | #286 | Tragic $37,699 |
| Dominicans | 0.1 /100 | #287 | Tragic $37,697 |
| Blackfeet | 0.1 /100 | #288 | Tragic $37,695 |
| U.S. Virgin Islanders | 0.1 /100 | #289 | Tragic $37,589 |
| Immigrants | Guatemala | 0.1 /100 | #290 | Tragic $37,550 |
| Cajuns | 0.1 /100 | #291 | Tragic $37,527 |
Demographics Similar to Immigrants from Cuba by Per Capita Income
In terms of per capita income, the demographic groups most similar to Immigrants from Cuba are Apache ($34,886, a difference of 0.070%), Immigrants from Central America ($34,974, a difference of 0.18%), Kiowa ($35,102, a difference of 0.55%), Menominee ($34,578, a difference of 0.96%), and Mexican ($34,559, a difference of 1.0%).
| Demographics | Rating | Rank | Per Capita Income |
| Immigrants | Congo | 0.0 /100 | #319 | Tragic $35,720 |
| Hispanics or Latinos | 0.0 /100 | #320 | Tragic $35,688 |
| Blacks/African Americans | 0.0 /100 | #321 | Tragic $35,564 |
| Creek | 0.0 /100 | #322 | Tragic $35,546 |
| Cheyenne | 0.0 /100 | #323 | Tragic $35,276 |
| Kiowa | 0.0 /100 | #324 | Tragic $35,102 |
| Immigrants | Central America | 0.0 /100 | #325 | Tragic $34,974 |
| Immigrants | Cuba | 0.0 /100 | #326 | Tragic $34,910 |
| Apache | 0.0 /100 | #327 | Tragic $34,886 |
| Menominee | 0.0 /100 | #328 | Tragic $34,578 |
| Mexicans | 0.0 /100 | #329 | Tragic $34,559 |
| Spanish American Indians | 0.0 /100 | #330 | Tragic $34,195 |
| Immigrants | Mexico | 0.0 /100 | #331 | Tragic $33,931 |
| Sioux | 0.0 /100 | #332 | Tragic $33,921 |
| Immigrants | Yemen | 0.0 /100 | #333 | Tragic $33,696 |