African vs Immigrants from Haiti 6th Grade
COMPARE
African
Immigrants from Haiti
6th Grade
6th Grade Comparison
Africans
Immigrants from Haiti
96.9%
6TH GRADE
14.8/ 100
METRIC RATING
200th/ 347
METRIC RANK
95.6%
6TH GRADE
0.0/ 100
METRIC RATING
306th/ 347
METRIC RANK
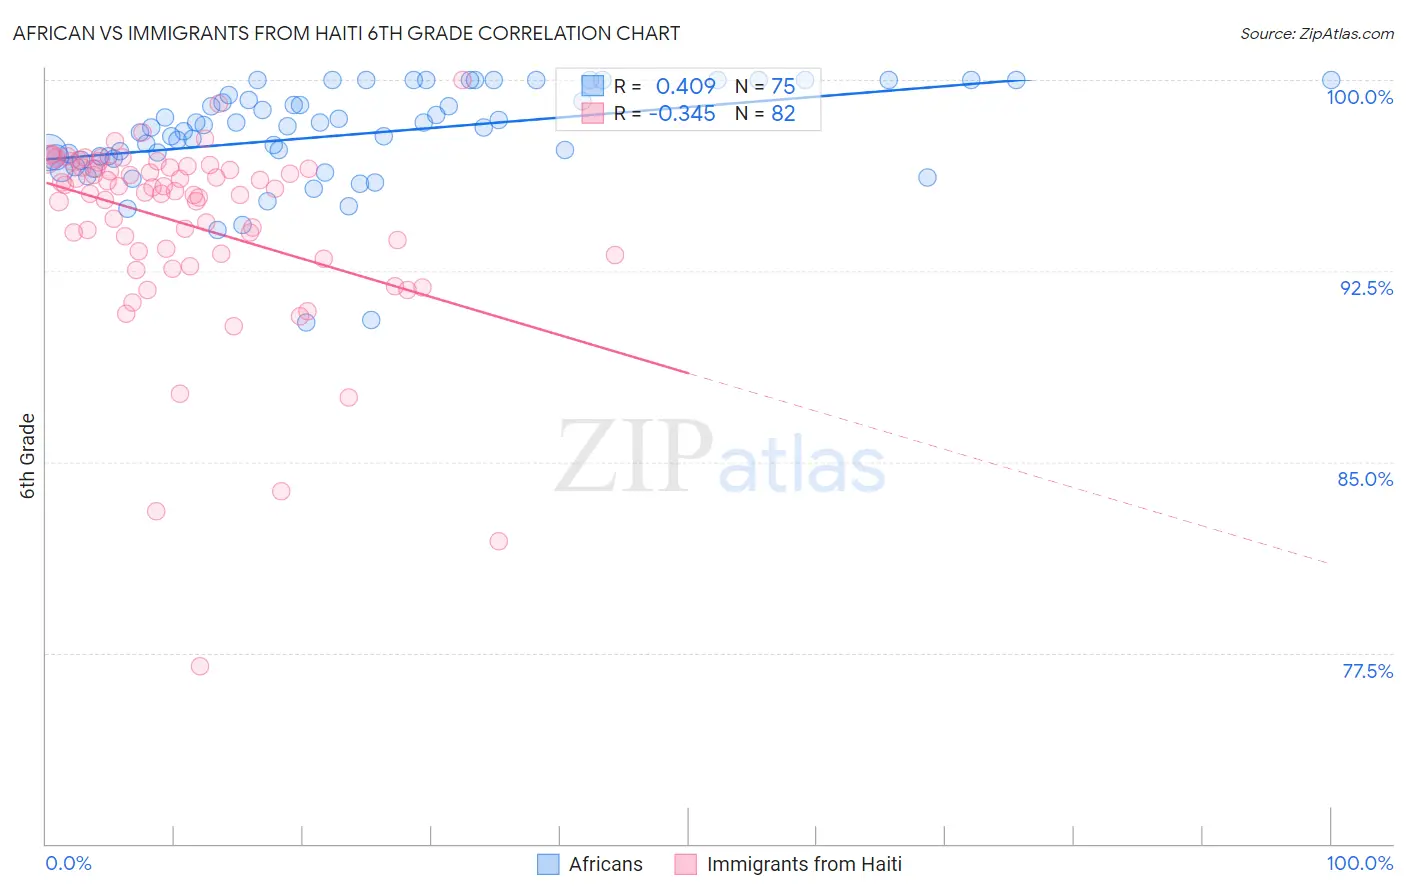
African vs Immigrants from Haiti 6th Grade Correlation Chart
The statistical analysis conducted on geographies consisting of 470,094,744 people shows a moderate positive correlation between the proportion of Africans and percentage of population with at least 6th grade education in the United States with a correlation coefficient (R) of 0.409 and weighted average of 96.9%. Similarly, the statistical analysis conducted on geographies consisting of 225,287,083 people shows a mild negative correlation between the proportion of Immigrants from Haiti and percentage of population with at least 6th grade education in the United States with a correlation coefficient (R) of -0.345 and weighted average of 95.6%, a difference of 1.3%.
6th Grade Correlation Summary
| Measurement | African | Immigrants from Haiti |
| Minimum | 90.5% | 76.9% |
| Maximum | 100.0% | 100.0% |
| Range | 9.5% | 23.1% |
| Mean | 97.8% | 94.3% |
| Median | 98.1% | 95.6% |
| Interquartile 25% (IQ1) | 96.9% | 93.2% |
| Interquartile 75% (IQ3) | 99.4% | 96.6% |
| Interquartile Range (IQR) | 2.5% | 3.4% |
| Standard Deviation (Sample) | 2.0% | 3.8% |
| Standard Deviation (Population) | 2.0% | 3.8% |
Similar Demographics by 6th Grade
Demographics Similar to Africans by 6th Grade
In terms of 6th grade, the demographic groups most similar to Africans are Immigrants from Zaire (96.9%, a difference of 0.0%), Immigrants from Northern Africa (96.9%, a difference of 0.010%), Immigrants from Chile (96.8%, a difference of 0.010%), Sudanese (96.8%, a difference of 0.010%), and Immigrants from Bahamas (96.8%, a difference of 0.010%).
| Demographics | Rating | Rank | 6th Grade |
| Paraguayans | 26.6 /100 | #193 | Fair 96.9% |
| Immigrants | Lebanon | 25.6 /100 | #194 | Fair 96.9% |
| Immigrants | Brazil | 25.5 /100 | #195 | Fair 96.9% |
| Immigrants | Uganda | 21.2 /100 | #196 | Fair 96.9% |
| Brazilians | 20.1 /100 | #197 | Fair 96.9% |
| Immigrants | Albania | 18.8 /100 | #198 | Poor 96.9% |
| Immigrants | Northern Africa | 15.7 /100 | #199 | Poor 96.9% |
| Africans | 14.8 /100 | #200 | Poor 96.9% |
| Immigrants | Zaire | 14.5 /100 | #201 | Poor 96.9% |
| Immigrants | Chile | 14.2 /100 | #202 | Poor 96.8% |
| Sudanese | 13.9 /100 | #203 | Poor 96.8% |
| Immigrants | Bahamas | 13.8 /100 | #204 | Poor 96.8% |
| Natives/Alaskans | 13.0 /100 | #205 | Poor 96.8% |
| Laotians | 11.8 /100 | #206 | Poor 96.8% |
| Iraqis | 11.7 /100 | #207 | Poor 96.8% |
Demographics Similar to Immigrants from Haiti by 6th Grade
In terms of 6th grade, the demographic groups most similar to Immigrants from Haiti are Guyanese (95.6%, a difference of 0.020%), Immigrants from Caribbean (95.6%, a difference of 0.030%), Immigrants from Cuba (95.6%, a difference of 0.040%), Indonesian (95.6%, a difference of 0.060%), and Bangladeshi (95.7%, a difference of 0.070%).
| Demographics | Rating | Rank | 6th Grade |
| Immigrants | Laos | 0.0 /100 | #299 | Tragic 95.7% |
| Immigrants | Dominica | 0.0 /100 | #300 | Tragic 95.7% |
| Immigrants | Immigrants | 0.0 /100 | #301 | Tragic 95.7% |
| Immigrants | Burma/Myanmar | 0.0 /100 | #302 | Tragic 95.7% |
| Bangladeshis | 0.0 /100 | #303 | Tragic 95.7% |
| Indonesians | 0.0 /100 | #304 | Tragic 95.6% |
| Immigrants | Cuba | 0.0 /100 | #305 | Tragic 95.6% |
| Immigrants | Haiti | 0.0 /100 | #306 | Tragic 95.6% |
| Guyanese | 0.0 /100 | #307 | Tragic 95.6% |
| Immigrants | Caribbean | 0.0 /100 | #308 | Tragic 95.6% |
| Puerto Ricans | 0.0 /100 | #309 | Tragic 95.5% |
| Ecuadorians | 0.0 /100 | #310 | Tragic 95.5% |
| Immigrants | Portugal | 0.0 /100 | #311 | Tragic 95.5% |
| Immigrants | Guyana | 0.0 /100 | #312 | Tragic 95.5% |
| Nicaraguans | 0.0 /100 | #313 | Tragic 95.4% |