African vs Immigrants from China Per Capita Income
COMPARE
African
Immigrants from China
Per Capita Income
Per Capita Income Comparison
Africans
Immigrants from China
$37,785
PER CAPITA INCOME
0.1/ 100
METRIC RATING
284th/ 347
METRIC RANK
$54,264
PER CAPITA INCOME
100.0/ 100
METRIC RATING
19th/ 347
METRIC RANK
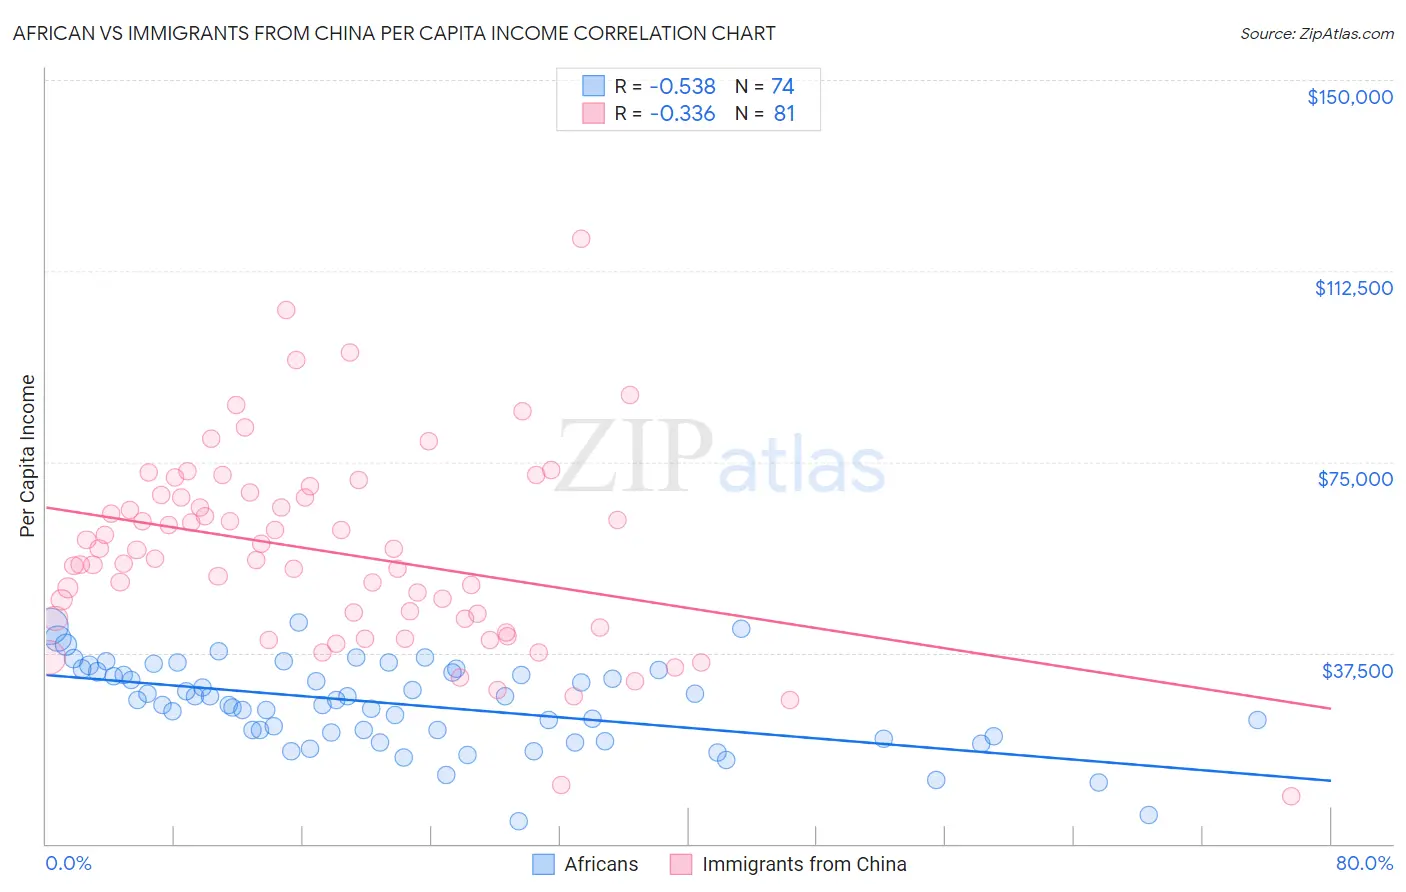
African vs Immigrants from China Per Capita Income Correlation Chart
The statistical analysis conducted on geographies consisting of 470,145,104 people shows a substantial negative correlation between the proportion of Africans and per capita income in the United States with a correlation coefficient (R) of -0.538 and weighted average of $37,785. Similarly, the statistical analysis conducted on geographies consisting of 457,115,430 people shows a mild negative correlation between the proportion of Immigrants from China and per capita income in the United States with a correlation coefficient (R) of -0.336 and weighted average of $54,264, a difference of 43.6%.
Per Capita Income Correlation Summary
| Measurement | African | Immigrants from China |
| Minimum | $4,302 | $9,290 |
| Maximum | $43,354 | $118,834 |
| Range | $39,052 | $109,544 |
| Mean | $27,384 | $57,158 |
| Median | $28,229 | $56,059 |
| Interquartile 25% (IQ1) | $21,779 | $43,379 |
| Interquartile 75% (IQ3) | $33,791 | $68,324 |
| Interquartile Range (IQR) | $12,012 | $24,945 |
| Standard Deviation (Sample) | $8,322 | $19,265 |
| Standard Deviation (Population) | $8,265 | $19,145 |
Similar Demographics by Per Capita Income
Demographics Similar to Africans by Per Capita Income
In terms of per capita income, the demographic groups most similar to Africans are Guatemalan ($37,766, a difference of 0.050%), Pennsylvania German ($37,842, a difference of 0.15%), Immigrants from Laos ($37,857, a difference of 0.19%), Central American Indian ($37,699, a difference of 0.23%), and Dominican ($37,697, a difference of 0.24%).
| Demographics | Rating | Rank | Per Capita Income |
| Comanche | 0.2 /100 | #277 | Tragic $38,088 |
| Immigrants | Nicaragua | 0.2 /100 | #278 | Tragic $38,065 |
| Colville | 0.2 /100 | #279 | Tragic $38,047 |
| Potawatomi | 0.2 /100 | #280 | Tragic $38,046 |
| Immigrants | Dominica | 0.2 /100 | #281 | Tragic $37,952 |
| Immigrants | Laos | 0.1 /100 | #282 | Tragic $37,857 |
| Pennsylvania Germans | 0.1 /100 | #283 | Tragic $37,842 |
| Africans | 0.1 /100 | #284 | Tragic $37,785 |
| Guatemalans | 0.1 /100 | #285 | Tragic $37,766 |
| Central American Indians | 0.1 /100 | #286 | Tragic $37,699 |
| Dominicans | 0.1 /100 | #287 | Tragic $37,697 |
| Blackfeet | 0.1 /100 | #288 | Tragic $37,695 |
| U.S. Virgin Islanders | 0.1 /100 | #289 | Tragic $37,589 |
| Immigrants | Guatemala | 0.1 /100 | #290 | Tragic $37,550 |
| Cajuns | 0.1 /100 | #291 | Tragic $37,527 |
Demographics Similar to Immigrants from China by Per Capita Income
In terms of per capita income, the demographic groups most similar to Immigrants from China are Thai ($54,307, a difference of 0.080%), Soviet Union ($54,202, a difference of 0.11%), Immigrants from Northern Europe ($54,159, a difference of 0.19%), Immigrants from France ($54,557, a difference of 0.54%), and Indian (Asian) ($53,874, a difference of 0.72%).
| Demographics | Rating | Rank | Per Capita Income |
| Immigrants | Sweden | 100.0 /100 | #12 | Exceptional $55,582 |
| Immigrants | India | 100.0 /100 | #13 | Exceptional $55,268 |
| Immigrants | Belgium | 100.0 /100 | #14 | Exceptional $55,082 |
| Cypriots | 100.0 /100 | #15 | Exceptional $54,899 |
| Immigrants | Switzerland | 100.0 /100 | #16 | Exceptional $54,866 |
| Immigrants | France | 100.0 /100 | #17 | Exceptional $54,557 |
| Thais | 100.0 /100 | #18 | Exceptional $54,307 |
| Immigrants | China | 100.0 /100 | #19 | Exceptional $54,264 |
| Soviet Union | 100.0 /100 | #20 | Exceptional $54,202 |
| Immigrants | Northern Europe | 100.0 /100 | #21 | Exceptional $54,159 |
| Indians (Asian) | 100.0 /100 | #22 | Exceptional $53,874 |
| Immigrants | Eastern Asia | 100.0 /100 | #23 | Exceptional $53,806 |
| Immigrants | Denmark | 100.0 /100 | #24 | Exceptional $53,799 |
| Immigrants | Japan | 100.0 /100 | #25 | Exceptional $53,359 |
| Russians | 100.0 /100 | #26 | Exceptional $53,154 |