Afghan vs Zimbabwean Median Household Income
COMPARE
Afghan
Zimbabwean
Median Household Income
Median Household Income Comparison
Afghans
Zimbabweans
$97,026
MEDIAN HOUSEHOLD INCOME
100.0/ 100
METRIC RATING
39th/ 347
METRIC RANK
$90,618
MEDIAN HOUSEHOLD INCOME
97.2/ 100
METRIC RATING
108th/ 347
METRIC RANK
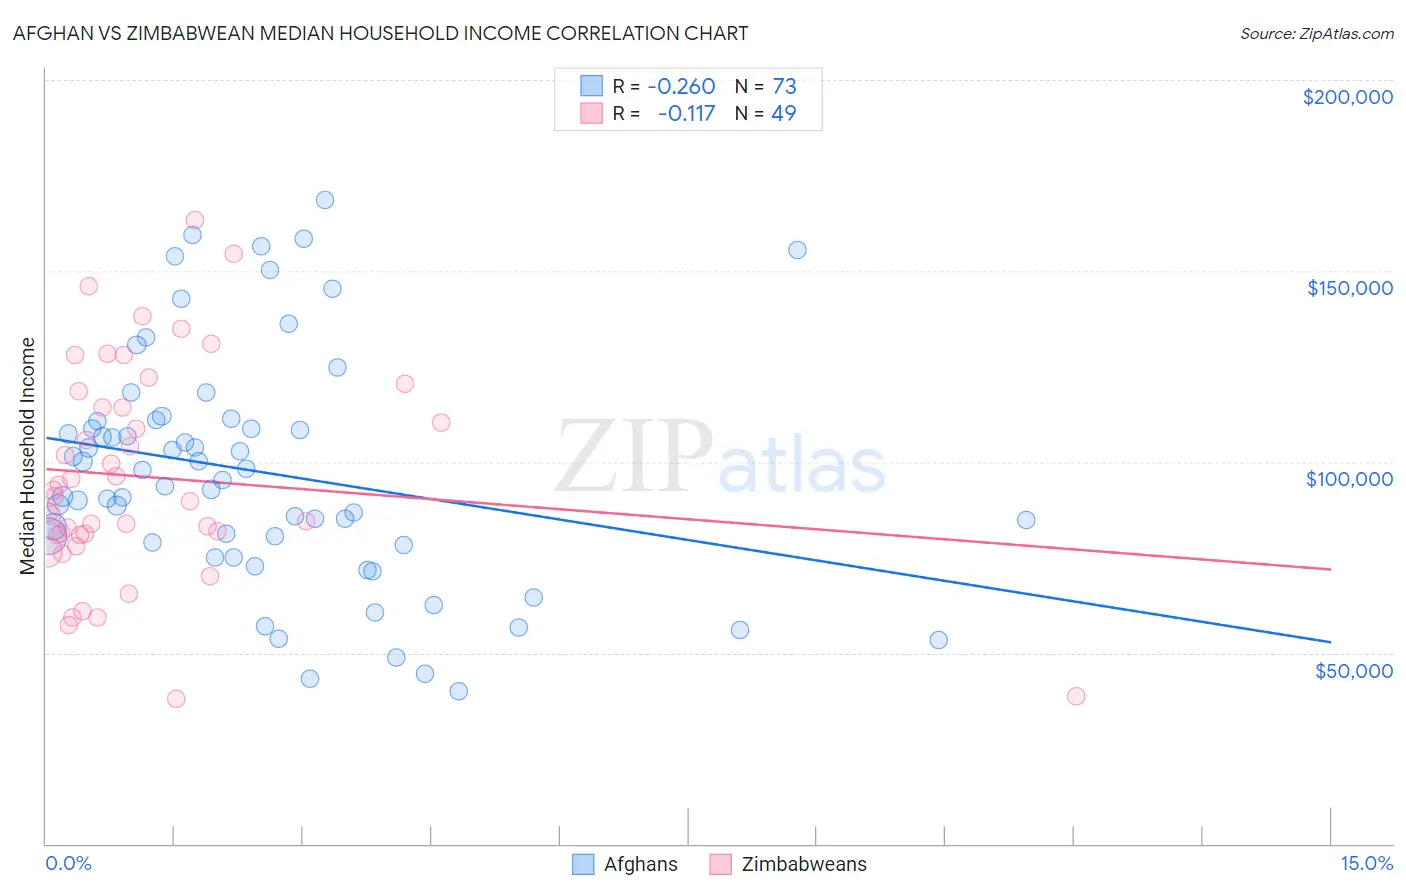
Afghan vs Zimbabwean Median Household Income Correlation Chart
The statistical analysis conducted on geographies consisting of 148,820,759 people shows a weak negative correlation between the proportion of Afghans and median household income in the United States with a correlation coefficient (R) of -0.260 and weighted average of $97,026. Similarly, the statistical analysis conducted on geographies consisting of 69,185,411 people shows a poor negative correlation between the proportion of Zimbabweans and median household income in the United States with a correlation coefficient (R) of -0.117 and weighted average of $90,618, a difference of 7.1%.
Median Household Income Correlation Summary
| Measurement | Afghan | Zimbabwean |
| Minimum | $40,069 | $38,056 |
| Maximum | $168,646 | $163,274 |
| Range | $128,577 | $125,218 |
| Mean | $97,284 | $96,050 |
| Median | $95,399 | $90,998 |
| Interquartile 25% (IQ1) | $78,550 | $80,817 |
| Interquartile 75% (IQ3) | $110,861 | $116,275 |
| Interquartile Range (IQR) | $32,311 | $35,458 |
| Standard Deviation (Sample) | $30,429 | $28,116 |
| Standard Deviation (Population) | $30,220 | $27,827 |
Similar Demographics by Median Household Income
Demographics Similar to Afghans by Median Household Income
In terms of median household income, the demographic groups most similar to Afghans are Maltese ($97,015, a difference of 0.010%), Immigrants from Turkey ($96,964, a difference of 0.060%), Immigrants from Lithuania ($96,836, a difference of 0.20%), Immigrants from Indonesia ($97,297, a difference of 0.28%), and Latvian ($97,311, a difference of 0.29%).
| Demographics | Rating | Rank | Median Household Income |
| Immigrants | Denmark | 100.0 /100 | #32 | Exceptional $98,510 |
| Chinese | 100.0 /100 | #33 | Exceptional $98,496 |
| Russians | 100.0 /100 | #34 | Exceptional $98,008 |
| Immigrants | Switzerland | 100.0 /100 | #35 | Exceptional $97,979 |
| Immigrants | Pakistan | 100.0 /100 | #36 | Exceptional $97,528 |
| Latvians | 100.0 /100 | #37 | Exceptional $97,311 |
| Immigrants | Indonesia | 100.0 /100 | #38 | Exceptional $97,297 |
| Afghans | 100.0 /100 | #39 | Exceptional $97,026 |
| Maltese | 100.0 /100 | #40 | Exceptional $97,015 |
| Immigrants | Turkey | 100.0 /100 | #41 | Exceptional $96,964 |
| Immigrants | Lithuania | 99.9 /100 | #42 | Exceptional $96,836 |
| Immigrants | France | 99.9 /100 | #43 | Exceptional $96,743 |
| Immigrants | Greece | 99.9 /100 | #44 | Exceptional $96,675 |
| Israelis | 99.9 /100 | #45 | Exceptional $96,552 |
| Australians | 99.9 /100 | #46 | Exceptional $96,490 |
Demographics Similar to Zimbabweans by Median Household Income
In terms of median household income, the demographic groups most similar to Zimbabweans are Chilean ($90,605, a difference of 0.020%), Palestinian ($90,574, a difference of 0.050%), Croatian ($90,685, a difference of 0.070%), Immigrants from Poland ($90,549, a difference of 0.080%), and Macedonian ($90,761, a difference of 0.16%).
| Demographics | Rating | Rank | Median Household Income |
| Immigrants | Moldova | 98.3 /100 | #101 | Exceptional $91,446 |
| Austrians | 98.2 /100 | #102 | Exceptional $91,339 |
| Immigrants | Ukraine | 98.0 /100 | #103 | Exceptional $91,124 |
| Immigrants | Kazakhstan | 97.8 /100 | #104 | Exceptional $91,015 |
| Immigrants | Brazil | 97.7 /100 | #105 | Exceptional $90,907 |
| Macedonians | 97.4 /100 | #106 | Exceptional $90,761 |
| Croatians | 97.3 /100 | #107 | Exceptional $90,685 |
| Zimbabweans | 97.2 /100 | #108 | Exceptional $90,618 |
| Chileans | 97.2 /100 | #109 | Exceptional $90,605 |
| Palestinians | 97.1 /100 | #110 | Exceptional $90,574 |
| Immigrants | Poland | 97.1 /100 | #111 | Exceptional $90,549 |
| Northern Europeans | 96.9 /100 | #112 | Exceptional $90,446 |
| Peruvians | 96.5 /100 | #113 | Exceptional $90,261 |
| Immigrants | Northern Africa | 95.9 /100 | #114 | Exceptional $90,026 |
| Immigrants | Western Asia | 95.9 /100 | #115 | Exceptional $90,005 |