Immigrants from Saudi Arabia vs Immigrants from Switzerland Married-couple Households
COMPARE
Immigrants from Saudi Arabia
Immigrants from Switzerland
Married-couple Households
Married-couple Households Comparison
Immigrants from Saudi Arabia
Immigrants from Switzerland
44.4%
MARRIED-COUPLE HOUSEHOLDS
0.9/ 100
METRIC RATING
243rd/ 347
METRIC RANK
46.2%
MARRIED-COUPLE HOUSEHOLDS
36.9/ 100
METRIC RATING
184th/ 347
METRIC RANK
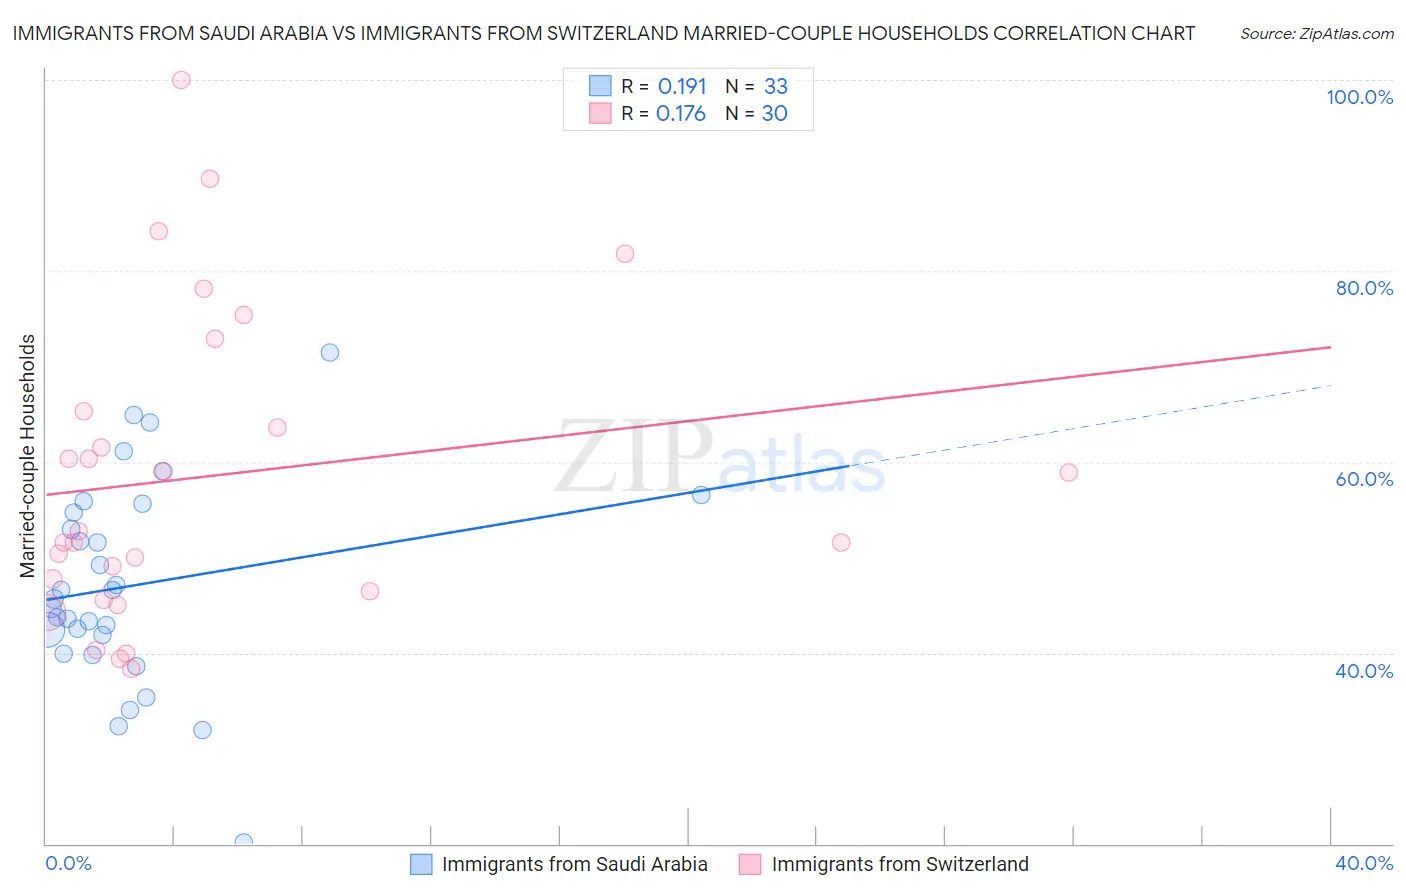
Immigrants from Saudi Arabia vs Immigrants from Switzerland Married-couple Households Correlation Chart
The statistical analysis conducted on geographies consisting of 164,204,470 people shows a poor positive correlation between the proportion of Immigrants from Saudi Arabia and percentage of married-couple family households in the United States with a correlation coefficient (R) of 0.191 and weighted average of 44.4%. Similarly, the statistical analysis conducted on geographies consisting of 148,072,536 people shows a poor positive correlation between the proportion of Immigrants from Switzerland and percentage of married-couple family households in the United States with a correlation coefficient (R) of 0.176 and weighted average of 46.2%, a difference of 4.1%.
Married-couple Households Correlation Summary
| Measurement | Immigrants from Saudi Arabia | Immigrants from Switzerland |
| Minimum | 20.1% | 38.3% |
| Maximum | 71.4% | 100.0% |
| Range | 51.4% | 61.7% |
| Mean | 47.0% | 58.5% |
| Median | 45.6% | 52.2% |
| Interquartile 25% (IQ1) | 40.8% | 46.4% |
| Interquartile 75% (IQ3) | 55.2% | 65.4% |
| Interquartile Range (IQR) | 14.3% | 19.0% |
| Standard Deviation (Sample) | 10.8% | 16.1% |
| Standard Deviation (Population) | 10.6% | 15.8% |
Similar Demographics by Married-couple Households
Demographics Similar to Immigrants from Saudi Arabia by Married-couple Households
In terms of married-couple households, the demographic groups most similar to Immigrants from Saudi Arabia are Immigrants from Albania (44.4%, a difference of 0.070%), Ute (44.4%, a difference of 0.11%), Immigrants from Bosnia and Herzegovina (44.4%, a difference of 0.11%), Spanish American (44.5%, a difference of 0.19%), and Immigrants from Uruguay (44.5%, a difference of 0.21%).
| Demographics | Rating | Rank | Married-couple Households |
| Yaqui | 1.2 /100 | #236 | Tragic 44.5% |
| Comanche | 1.2 /100 | #237 | Tragic 44.5% |
| Immigrants | Uruguay | 1.1 /100 | #238 | Tragic 44.5% |
| Spanish Americans | 1.1 /100 | #239 | Tragic 44.5% |
| Ute | 1.0 /100 | #240 | Tragic 44.4% |
| Immigrants | Bosnia and Herzegovina | 1.0 /100 | #241 | Tragic 44.4% |
| Immigrants | Albania | 1.0 /100 | #242 | Tragic 44.4% |
| Immigrants | Saudi Arabia | 0.9 /100 | #243 | Tragic 44.4% |
| Immigrants | Armenia | 0.7 /100 | #244 | Tragic 44.3% |
| Immigrants | El Salvador | 0.7 /100 | #245 | Tragic 44.3% |
| Immigrants | Cuba | 0.6 /100 | #246 | Tragic 44.2% |
| Immigrants | Morocco | 0.6 /100 | #247 | Tragic 44.2% |
| Yup'ik | 0.4 /100 | #248 | Tragic 44.1% |
| Immigrants | Kenya | 0.4 /100 | #249 | Tragic 44.1% |
| French American Indians | 0.4 /100 | #250 | Tragic 44.1% |
Demographics Similar to Immigrants from Switzerland by Married-couple Households
In terms of married-couple households, the demographic groups most similar to Immigrants from Switzerland are Brazilian (46.2%, a difference of 0.040%), Immigrants from Brazil (46.2%, a difference of 0.060%), Yugoslavian (46.2%, a difference of 0.080%), Mongolian (46.3%, a difference of 0.20%), and Malaysian (46.3%, a difference of 0.20%).
| Demographics | Rating | Rank | Married-couple Households |
| Immigrants | Immigrants | 43.8 /100 | #177 | Average 46.3% |
| Immigrants | Costa Rica | 43.4 /100 | #178 | Average 46.3% |
| Immigrants | Zimbabwe | 43.0 /100 | #179 | Average 46.3% |
| Mongolians | 42.0 /100 | #180 | Average 46.3% |
| Malaysians | 41.8 /100 | #181 | Average 46.3% |
| Yugoslavians | 38.9 /100 | #182 | Fair 46.2% |
| Immigrants | Brazil | 38.3 /100 | #183 | Fair 46.2% |
| Immigrants | Switzerland | 36.9 /100 | #184 | Fair 46.2% |
| Brazilians | 35.9 /100 | #185 | Fair 46.2% |
| Albanians | 31.1 /100 | #186 | Fair 46.1% |
| Fijians | 29.2 /100 | #187 | Fair 46.1% |
| South American Indians | 28.4 /100 | #188 | Fair 46.0% |
| Immigrants | Latvia | 26.9 /100 | #189 | Fair 46.0% |
| Immigrants | Kuwait | 25.6 /100 | #190 | Fair 46.0% |
| Choctaw | 24.9 /100 | #191 | Fair 46.0% |